
dsh-otel
キュレーション掲載メンテナンス: 活発tma1-ai/dsh-otel
DeepSeek HarnessのOpenTelemetryトレース・メトリクス・ログをGreptimeDBへ直接書き込み。
$ dsh plugin add dsh-otel9
スター
2
フォーク
TypeScript
言語
Apache-2.0
ライセンス
2026-08-25
作成日
2026-09-03
最終プッシュ
README
@tma1-ai/dsh-plugin-greptimedb




English | 中文
What a DeepSeek Harness run costs you in tokens, money, and time, written into GreptimeDB as OpenTelemetry traces, metrics, and logs.
Seven Grafana dashboards read it back. No collector. No sidecar. No fork of DSH. It installs as an ordinary plugin, and every turn, model call, and tool execution becomes a row you can query:
-- Slowest tool calls, with the model that requested them.
SELECT span_name, model, duration_nano / 1000000 AS ms
FROM (
  SELECT span_name, duration_nano,
         MAX("span_attributes.gen_ai.request.model")
           OVER (PARTITION BY trace_id, "span_attributes.dsh.step") AS model
  FROM opentelemetry_traces
  WHERE "span_attributes.dsh.step" IS NOT NULL
)
WHERE span_name LIKE 'execute_tool%'
ORDER BY duration_nano DESC
LIMIT 10;
Quick start
Requires pnpm 10 or newer. dsh plugin forwards to whichever pnpm is on your PATH, and a dsh profile directory is its own pnpm workspace root. pnpm 9 refuses to install there and ignores the linker settings dsh writes.
Start the database and Grafana. The compose stack under grafana/ brings up GreptimeDB with the seven dashboards provisioned. Grafana reads those dashboards off disk, so fetch that one directory instead of cloning the repository:
curl -fsSL https://github.com/tma1-ai/dsh-otel/archive/main.tar.gz \
  | tar -xz --strip-components=1 dsh-otel-main/grafana
cd grafana && docker compose up -d
Install the plugin. Its defaults point at the database started above, so no configuration is required:
dsh plugin --profile web add @tma1-ai/dsh-plugin-greptimedb
The package ships a bundle patch, so that one command wires it into the profile.
Run DSH and check the data. Traces and logs are written within scheduledDelayMillis, 5 seconds by default; metrics on the next collection period, 30 seconds by default. DSH produces no data while idle, so run a task first:
dsh web
Grafana is at http://localhost:3000, with anonymous admin access enabled and no login required. Start with the Overview dashboard.
For the database alone, GreptimeDB's own console at http://localhost:4000/dashboard/ is enough to check the tables and run ad-hoc SQL:
docker run -p 127.0.0.1:4000-4003:4000-4003 \
  -v "$(pwd)/greptimedb_data:/greptimedb_data" \
  --name greptime --rm greptime/greptimedb:v1.2.0-beta.2 standalone start \
  --http-addr 0.0.0.0:4000 --rpc-bind-addr 0.0.0.0:4001 \
  --mysql-addr 0.0.0.0:4002 --postgres-addr 0.0.0.0:4003
Both bind port 4000, so run one or the other.
Compatibility
DSH package APIs change between prereleases, so each plugin release targets one DSH version:
| Plugin | npm tag | DSH |
|---|---|---|
0.1.0-beta.5 |
beta |
0.1.2-alpha.5 |
0.1.0-beta.4 and earlier |
latest |
0.1.1-rc.2 |
dsh plugin add with no version installs latest, which tracks DSH's own latest. Ask for the beta tag to follow the DSH alpha line — arguments are forwarded to pnpm add verbatim, so an exact version works the same way:
dsh plugin --profile web add @tma1-ai/dsh-plugin-greptimedb@beta
A mismatch is not a load failure. The plugin mounts, then drops every record with a greptimedb-otel: dropped a telemetry record warning, and the tables stay empty.
Configuration
To point the plugin at your own database, override the row in $DSH_HOME/profiles/<name>/cordis.patch.yml:
- id: greptimedb-otel
  name: '@tma1-ai/dsh-plugin-greptimedb'
  config:
    endpoint: https://<host>/v1/otlp
    database: <dbname>
    username: <user>
    password: <password>
A profile patch replaces the row's whole config instead of merging into it, so restate every field you want to keep.
| Key | Default | Notes |
|---|---|---|
endpoint |
(required) | OTLP base URL, e.g. http://localhost:4000/v1/otlp. The plugin appends each signal's /v1/{traces,metrics,logs} suffix; a per-signal path is rejected at load. |
database |
public |
Sent as X-Greptime-DB-Name. |
username / password |
(none) | Basic auth. Both or neither. |
signals |
all three | Any subset of traces, metrics, logs. A disabled signal builds no exporter. |
content |
none |
How much payload may leave the process. See What leaves the machine. |
serviceName |
dsh |
OTel service.name. |
logTable / traceTable |
GreptimeDB defaults | Destination table overrides. |
ttl |
180d |
Retention for the log and trace tables this plugin creates, sent as x-greptime-hints. Also accepts forever. GreptimeDB applies it when it auto-creates the table; an existing table keeps its own until ALTER TABLE. Metric tables are not covered — see Known limitations. Set it empty to send no hint and inherit the database default. |
shutdownTimeoutMillis |
3000 |
Deadline for the entire teardown sequence. |
metricIntervalMillis |
30000 |
Metric collection period. Must be at least exportTimeoutMillis. |
maxExportBatchSize / maxQueueSize |
512 / 2048 |
Batch and buffer bounds. |
scheduledDelayMillis / exportTimeoutMillis |
5000 / 30000 |
Export cadence and per-request deadline. |
Bad configuration fails at plugin load with the offending field named, not at the first export.
Traces
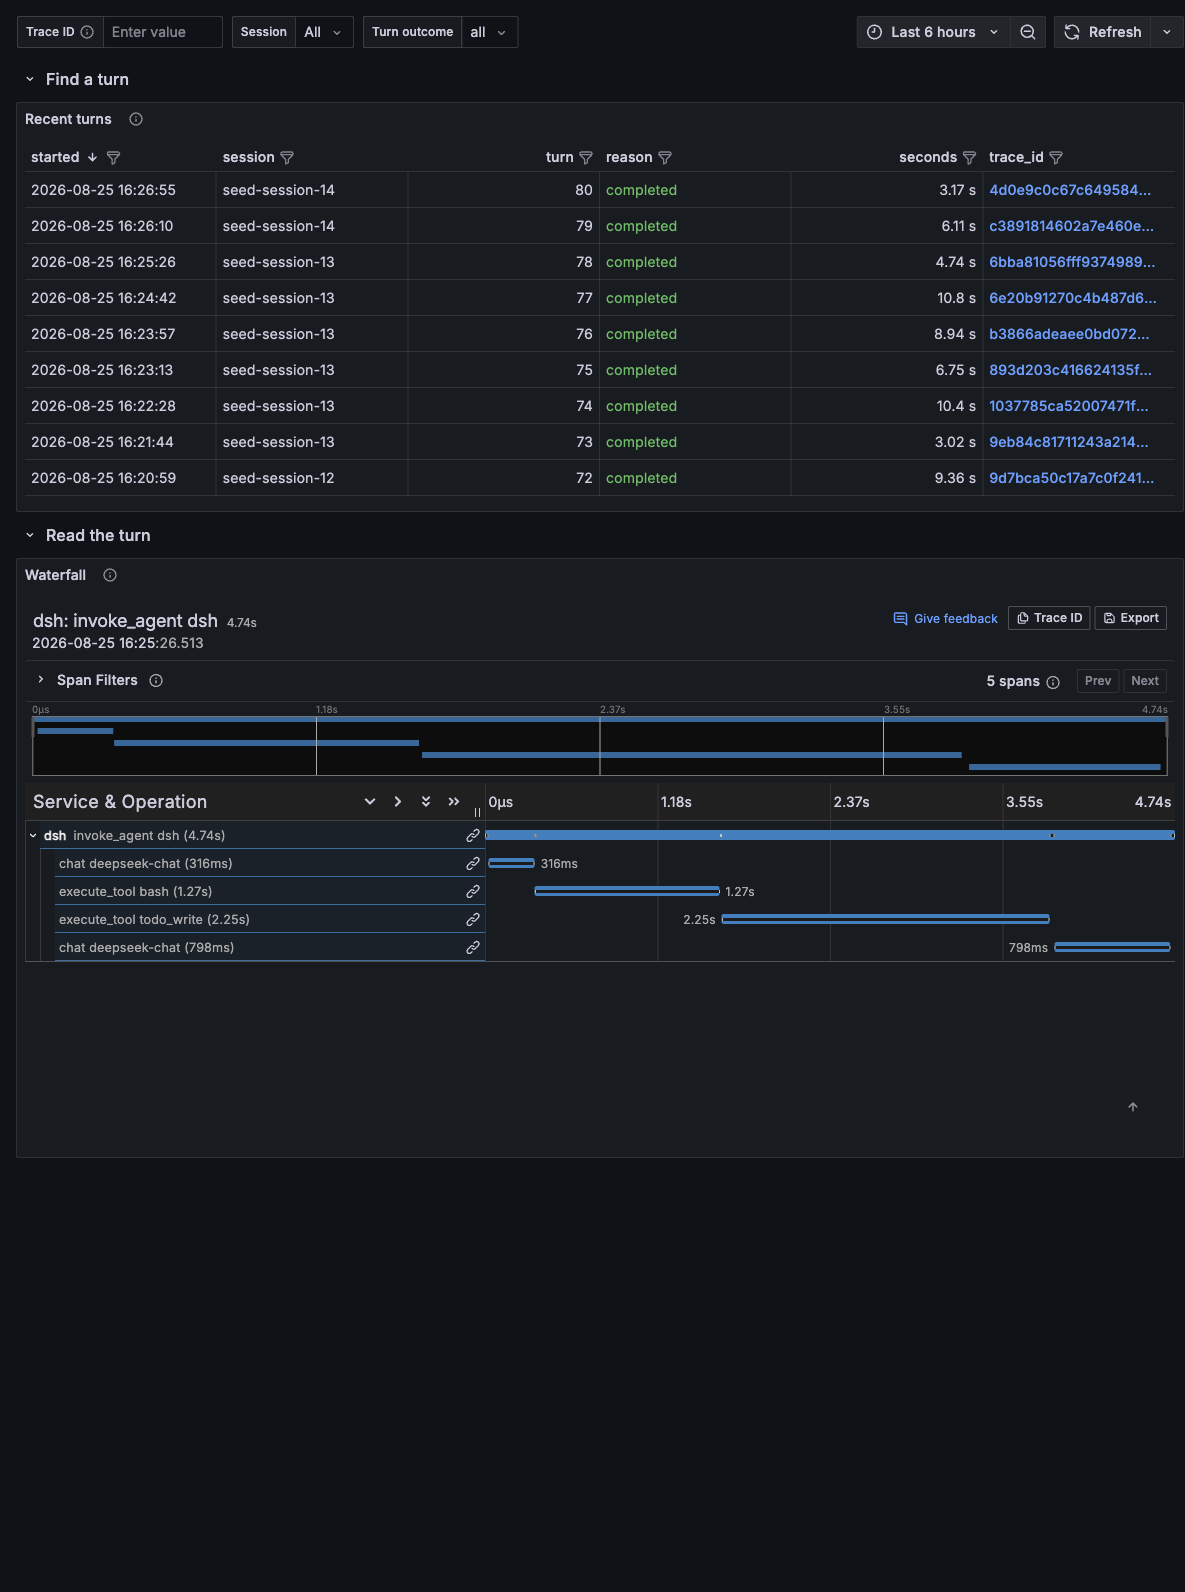
Turn spans are roots. Chat and tool spans hang off them as siblings, correlated by dsh.step:
invoke_agent dsh              turn/start → turn/end
├── chat deepseek-chat        step/start → assistant/message
├── execute_tool bash         tool/call  → tool/result
└── chat deepseek-chat
Every timestamp comes from the session event it belongs to, not from a clock read while the event is being handled.
A chat span closes on one of four paths, each with a defined end time:
| Situation | End time | Status |
|---|---|---|
| Model responded | assistant/message |
OK |
| Stream interrupted | assistant/message |
OK, plus dsh.response.interrupted |
| Request failed | that step's step/end |
ERROR, with the error type |
| No end event (crash, teardown) | last event seen | UNSET, plus dsh.span.unclosed |
Token accounting
DSH's counts are disjoint: inputTokens is uncached input alone, cache reads and writes are separate fields. gen_ai.usage.input_tokens is the billed total, so the plugin exports:
gen_ai.usage.input_tokens  = inputTokens + cacheReadTokens + cacheWriteTokens
gen_ai.usage.output_tokens = outputTokens          (reasoning tokens included)
The breakdown stays queryable as dsh.usage.uncached_input_tokens, dsh.usage.cache_read_tokens, dsh.usage.cache_write_tokens, and dsh.usage.reasoning_tokens.
Metrics
| Instrument | Type | Dimensions |
|---|---|---|
gen_ai.client.token.usage |
Histogram | gen_ai.token.type (input/output only), model, provider |
gen_ai.client.operation.duration |
Histogram | gen_ai.operation.name, model, provider |
gen_ai.invoke_agent.duration |
Histogram | gen_ai.operation.name |
gen_ai.execute_tool.duration |
Histogram | gen_ai.operation.name, gen_ai.tool.name |
dsh.token.detail |
Histogram | dsh.token.detail_kind (cache_read/cache_write/reasoning), model, provider |
dsh.tool.invocations |
Counter | gen_ai.tool.name, dsh.tool.outcome |
dsh.turns / dsh.steps |
Counter |
Logs
One record per session event. Four attributes become real columns through X-Greptime-Log-Extract-Keys:
SELECT session_id, event_type, turn, step, body
FROM dsh_logs
WHERE session_id = '...' AND event_type = 'tool/result'
ORDER BY timestamp;
assistant/chunk is never exported; the assembled assistant/message carries the same content.
What leaves the machine
content decides this. The default withholds all payloads.
| Mode | Exported |
|---|---|
none (default) |
Structure and accounting: event types, turn and step numbers, token counts, tool names, durations, outcomes, error name and code. |
full |
Adds user and assistant message content, tool arguments, tool results. |
full+prompt |
Adds request/header: the complete system prompt and every tool schema. |
Three things never leave in any mode: a tool's private meta payload, the internal error.message of a failed turn, and the message and stack of a failed request.
The projection is a positive allowlist, so an event type the plugin does not know exports its identity and nothing else. That includes types a future DSH plugin declares.
Dashboards
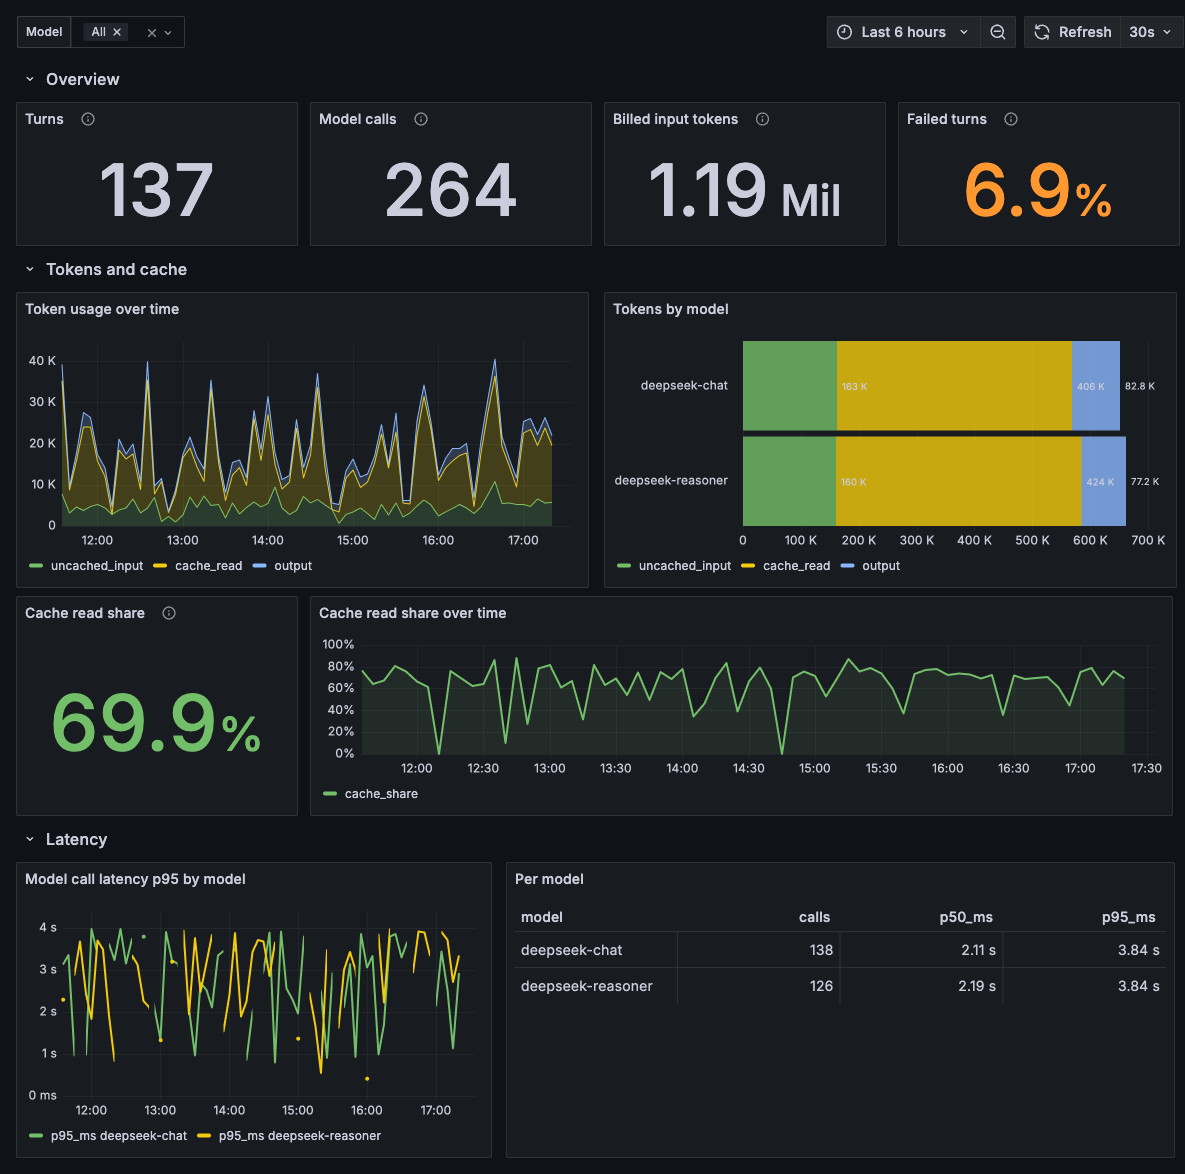
Seven Grafana dashboards ship in grafana/. The compose stack in Quick start provisions all of them.

| Dashboard | Answers |
|---|---|
| Overview | How many tokens, how fast, how much came from cache |
| Cost | What it cost in money, what the money bought, and why the bill grows |
| Sessions | How long a conversation ran, how many turns it took, where it failed |
| Agent loop | Which tools ran, how often they failed, how many model calls a turn needed, where a turn's time went |
| Trace explorer | What happened inside one specific turn, span by span |
| Log explorer | Every session event, filterable by session, type, and full-text search |
| Metrics | The same activity through PromQL, for longer retention and sampling-proof percentiles |
Cost prices the token counts with four rates you set in the dashboard's own variables, per million tokens: uncached input, cache read, cache write, output. The defaults are DeepSeek's published deepseek-v4-flash peak rates in CNY — 3.0, 0.10, 3.0, 9.0. The same rates in USD are 0.44, 0.014, 0.44, 1.32.
The Currency picker changes the symbol every panel formats with, not the rates, so retype those when you switch. Its values are Grafana units, currencyUSD and prefix:¥; another currency is one more option on that variable.
One rate set applies to every selected model, so pick a single model when you run several at different prices. The result is an estimate; it does not account for your contract price or a provider's time-of-day discount.
Every table links onward: a trace id opens that turn's waterfall, a session id jumps between the trace and log views. Every panel query is checked against a live database by node grafana/verify.mjs. See grafana/README.md for the datasource split and grafana/indexes.sql for the indexes these queries want.
With TMA1
TMA1 proxies OTLP into a GreptimeDB it manages. Point endpoint at it and DSH shows up in the OTel GenAI view:
endpoint: http://localhost:14318/v1/otlp
TMA1's tma1_token_usage_1m, cost_1m, latency_1m, and status_1m flow tables derive from span_attributes.gen_ai.*, which this plugin populates by convention.
Development
pnpm test     # unit, profile composition, Loader boot
pnpm smoke    # packaging checks against a freshly packed tarball
GREPTIMEDB_OTLP_ENDPOINT=http://localhost:4000/v1/otlp pnpm test   # adds the live database round trip
Known limitations
- DSH is pre-release and renames and repackages freely before its first tagged release. The plugin uses the DSH packages for types only and declares no peer range on them, because every DSH version is a prerelease and semver matches no prerelease a range does not name outright. Any range pinned here would fail on the next prerelease. The cost is that a rename in DSH does not fail the install; it fails CI, which runs against the version in Compatibility.
- The published
.d.tsimports DSH types. Type-checking this package outside a DSH install needsskipLibCheckon, or the DSH packages installed alongside it. - The GenAI conventions are experimental. Names come from
@opentelemetry/semantic-conventions/incubatingand move with it. Spans carry bothgen_ai.provider.nameand the deprecatedgen_ai.system. ttldoes not reach metric tables. Metrics land on the metric engine, where retention is a property of the physical table. The hint reaches the logical table, which stores and displays it but never enforces it (greptimedb#8951). Set it yourself withALTER TABLE greptime_physical_table SET 'ttl' = '180d'.- No per-turn flush. Export follows the batch processors' cadence.
- Shutdown is bounded. Records in flight when
shutdownTimeoutMillisexpires may be lost at exit. - Subagent sessions get their own trace, not stitched into the parent's.
License
Apache-2.0
利用量・課金 の他のプラグイン
dsh-cost-meter
by han-1413141
セッション/日次 API コスト、予算使用率、公式残高、履歴ダッシュボード、公式価格ワンクリック同期(ピーク/オフピーク)
dsh-usage-stats
by ychris12138
DSH Web GUI 向けトークンヒートマップ、モデル別内訳、DeepSeek 残高
tokdash
by jingbiaomei
セッションとクォータ使用量の可視化ダッシュボード。ヒートマップ、コスト追跡、トークンカウント
dsh-balance-meter
by ghost011118
DSH Web GUI に DeepSeek 残高とセッションコスト表示