
DSH token optimization: the dsh-ops 27x field test, frame by frame
One frame-verified recording: a real DeepSeek Harness log replay shows a standard-mode run burning 2.9 million tokens on a six-file task — and dsh-ops plus PTC mode finishing the same task at 104,835. Every number keeps its conditions.
Last updated: 2026-10-15
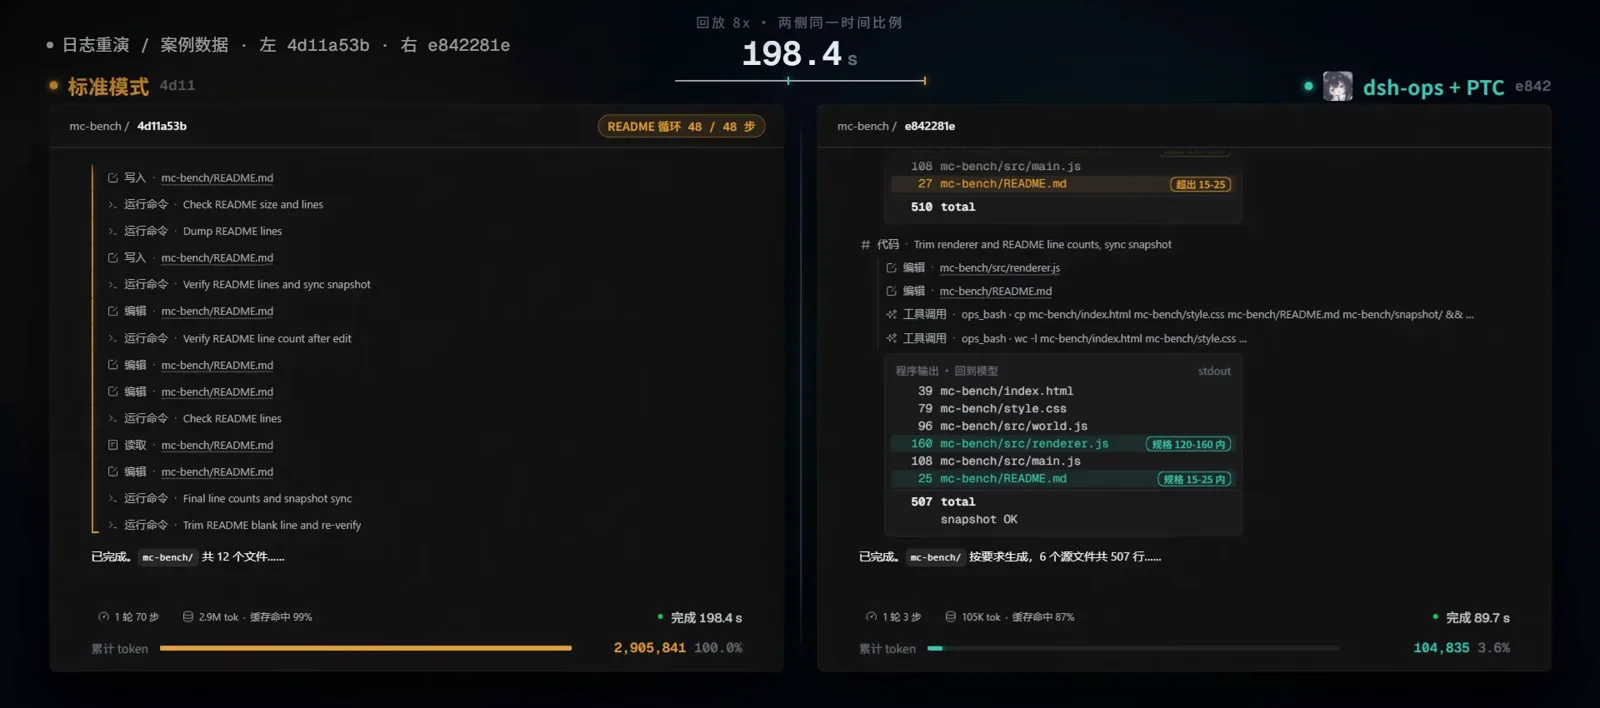
A dsh bill rarely spikes because the model got expensive; it spikes because of the loop. Every tool call sends the whole accumulated history back to the model, a standard-mode long task re-reads the same files dozens of times, and one "let me check the README again" round trip costs more than the code it guards. This page walks a measured example: the same six-file mini-game task run twice — once in standard mode, once with the third-party dsh-ops plugin plus PTC mode — with every number attributed to its uploader's own measurement.
This page is the fixing side — how to burn fewer tokens and what one plugin actually changes. For how to read the meters (usage dashboards, per-request receipts, cost structure, the dsh-ops discussion data), open Track dsh token usage & costs
TL;DR
- ▸In a standard-mode long task every tool call re-reads the whole history: the field test's standard run spent 2,905,841 tokens and 70 steps on a six-file mini-game, most of it re-checking one README (the uploader's own measurement).
- ▸dsh-ops (T-Auto) is a third-party Windows performance-tool plugin: standalone bash / PowerShell 7 plus Rust file and batch tools. In the same test, dsh-ops + PTC mode finished at 104,835 tokens, 3 steps, 89.7s — about 27.7x fewer tokens including the mode-choice bonus (the uploader's measurement).
- ▸Two levers, split: switching to plain PTC mode alone measured about 9.4x (307,998 tokens); the plugin added roughly another 2.9x on top. Change the mode first, then the toolchain.
- ▸The uploader himself says exact savings vary by task; what replicates is fewer error loops, less over-thinking, less attention drift. dsh-ops is third-party (license NOASSERTION) — treat it as such.
The six frame-verified steps
Part 1 · Why the bill is high — the re-read loop
- 1
Watch one tool call re-read the whole history
The replay opens on step 2 of the standard-mode run: the agent has just written index.html, style.css and world.js into mc-bench/. The callout on the right breaks down what this single call reads — S + t1 = 12,034 tokens, of which 10,736 is S, the system prompt plus the task. Every later call carries that payload again, whether or not the earlier steps changed anything.
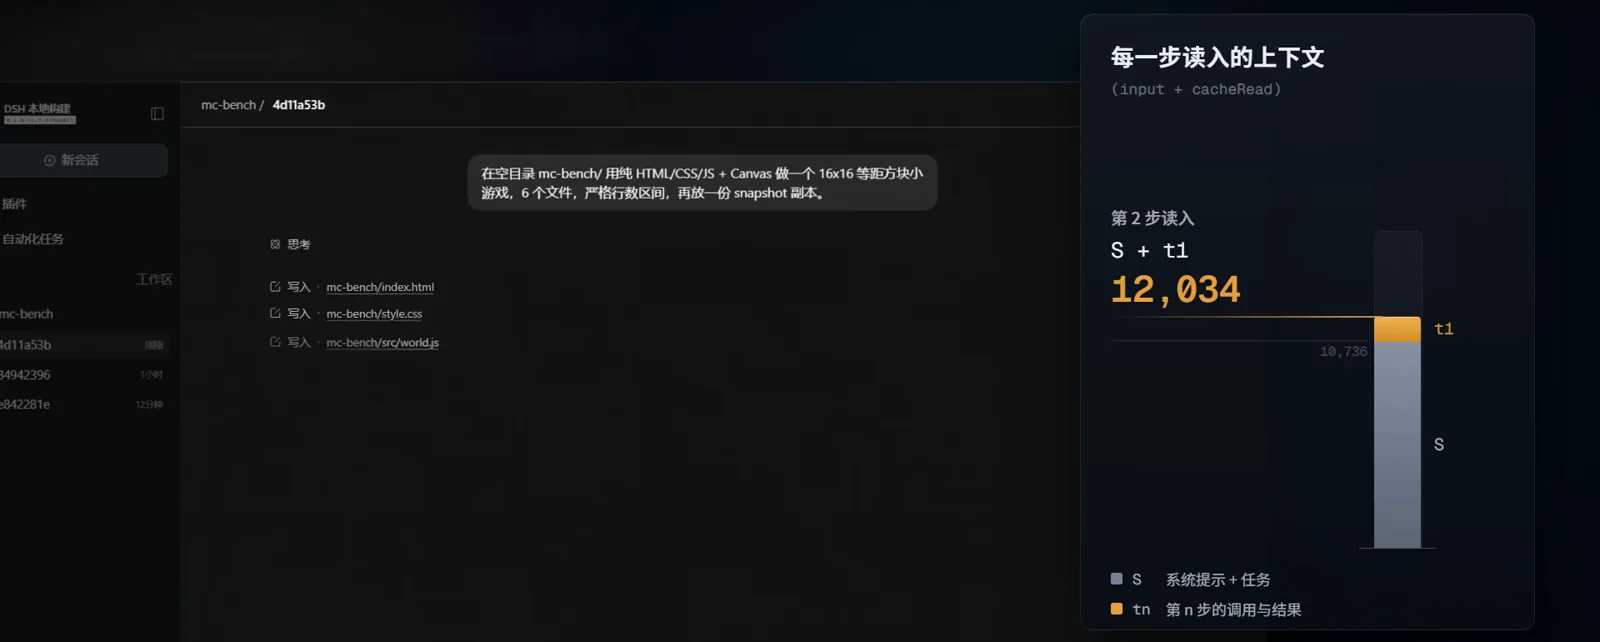
One tool call, 12,034 tokens of re-read: the system prompt and task never leave the bill.Watch at 0:22 - 2
The re-read compounds as the task gets longer
By step 21 the same gauge reads 34,471 tokens re-read for a single step — S plus twenty prior calls and their results. The run counter under the transcript shows 1 round, 21 steps, 533K tok, 97% cache hit. Cache discounts the repeat reads, but the bill still scales with work already done — which is why long tasks feel disproportionately expensive.
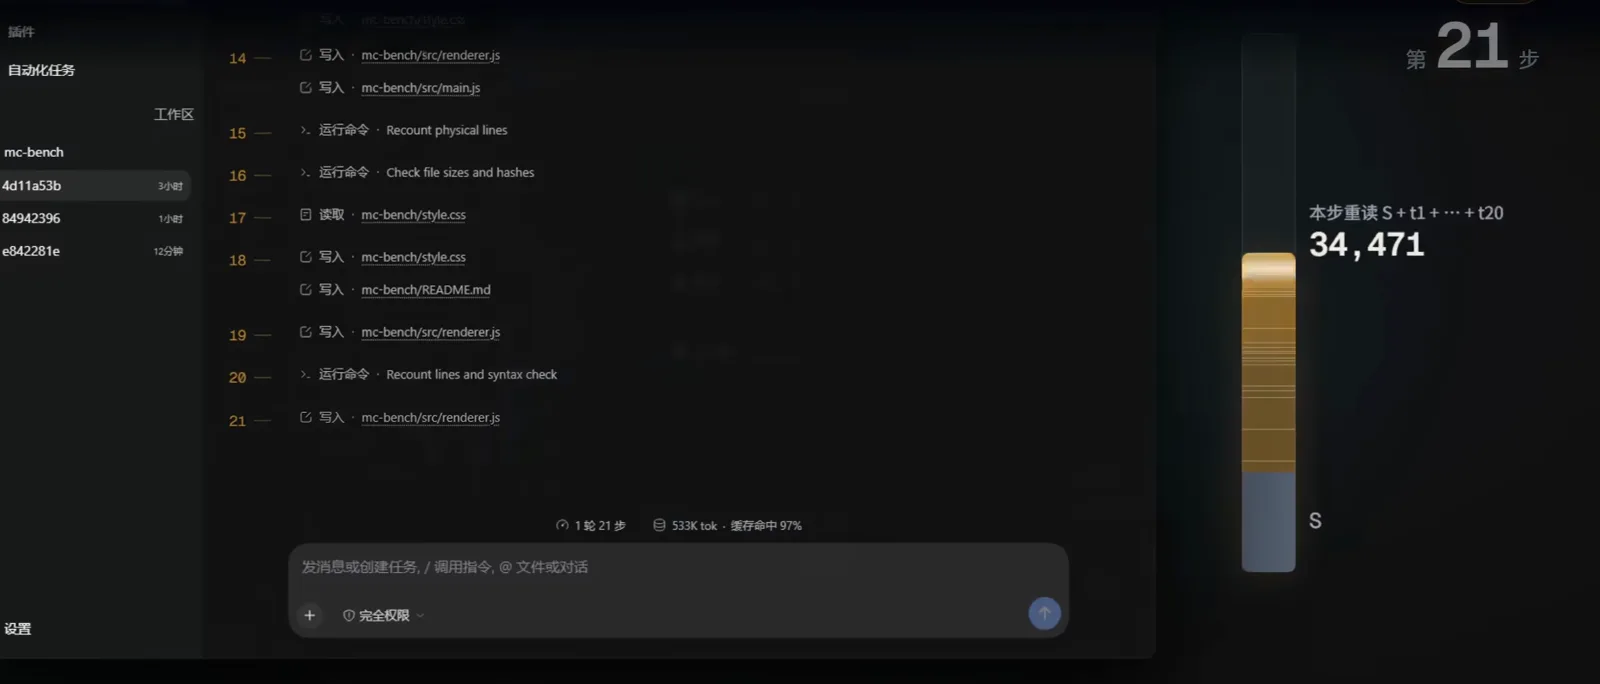
Step 21 re-reads 34,471 tokens — the loop compounds with every step the task runs.Watch at 0:36
Part 2 · The same task, two run styles
- 3
The test task: six files, strict line counts
Both runs must solve the same task: in an empty mc-bench/ directory, build a 16x16 isometric block mini-game with pure HTML/CSS/JS + Canvas, exactly six files, strict line-count ranges per file, plus a snapshot copy — the original brief is 2,045 characters (the overlay label shows it). Small enough to replay, tight enough that "just check the README again" becomes tempting.
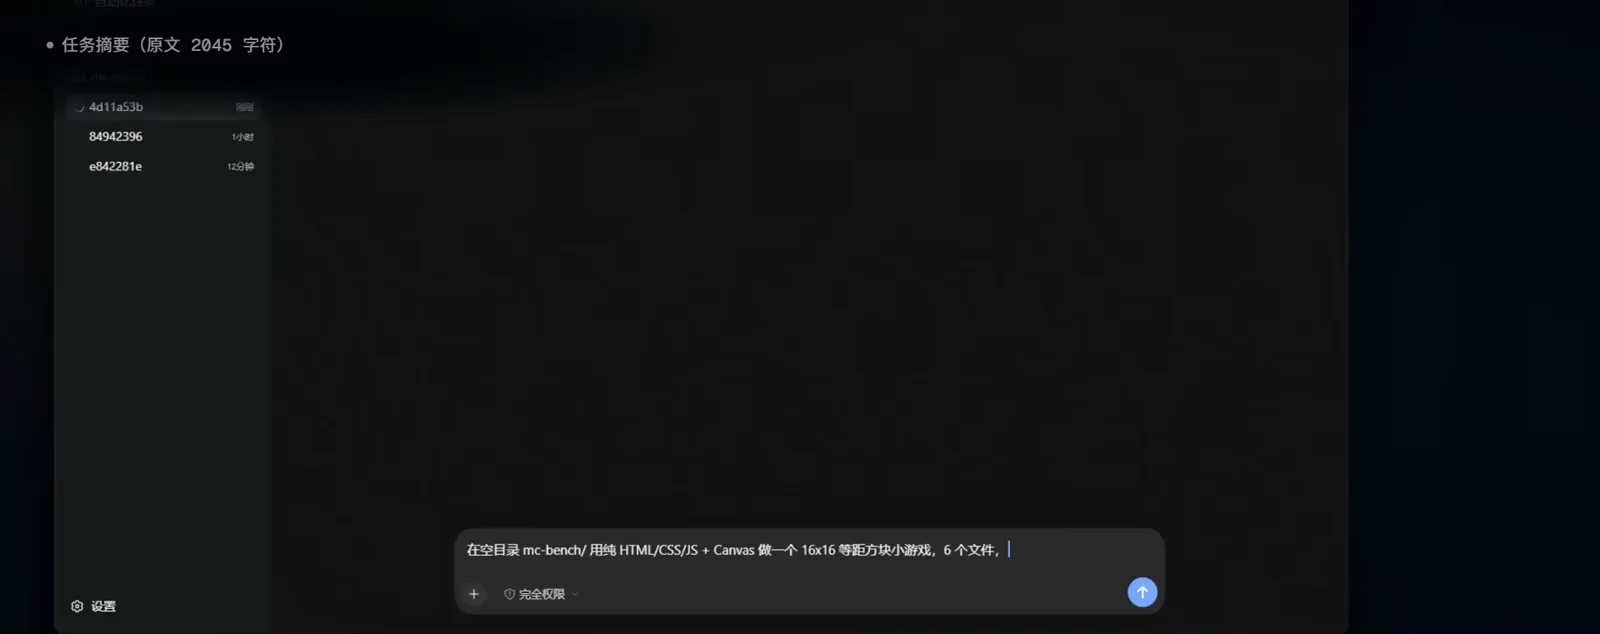
The six-file task both runs must solve — the original brief is 2,045 characters.Watch at 0:15 - 4
Standard mode: the README loop
The standard run (Windows PowerShell) reaches step 22 and starts rewriting mc-bench/README.md — then keeps circling it: write, run a line count, edit, read, write again. At this moment the run is 22 steps and 570K tok in; the finished panel carries a "README loop 48/48 steps" badge. Nothing exotic happened — ordinary verification, done the most expensive possible way.
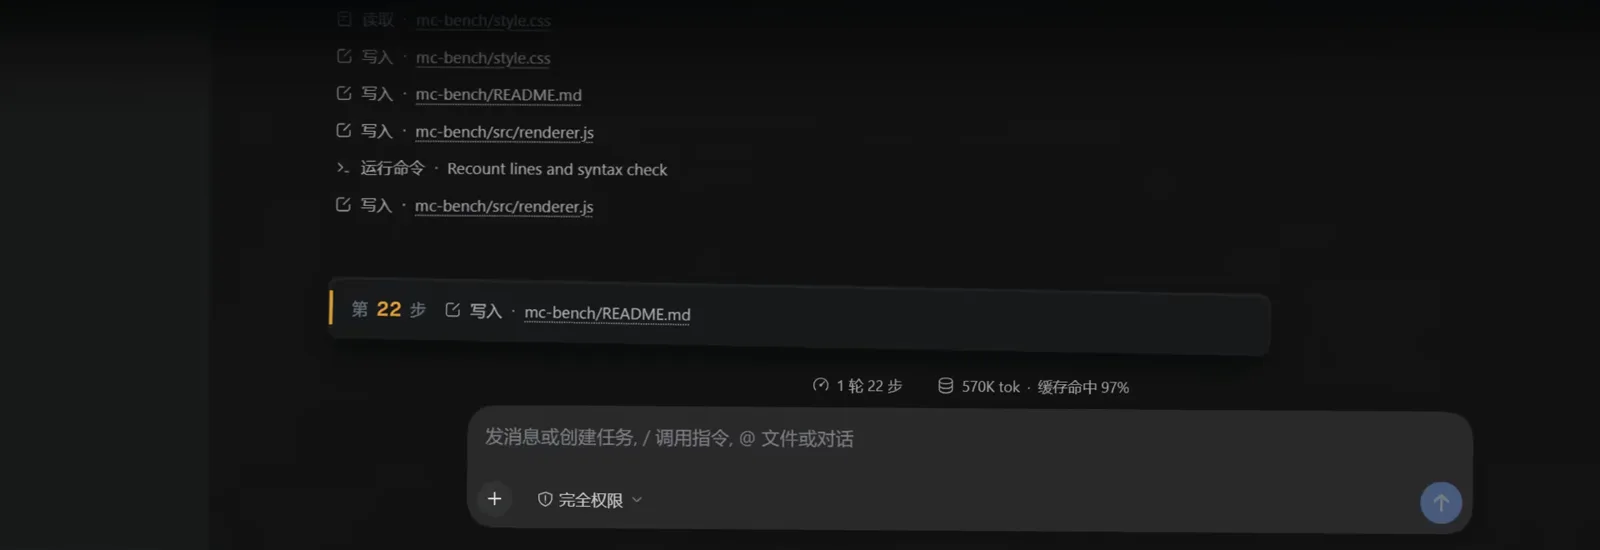
Standard mode starts rewriting the README at step 22 — the loop this page is about.Watch at 0:50 - 5
dsh-ops + PTC: one program instead of many round trips
The right-hand session (dsh-ops + PTC) writes one orchestration program — tools.ops_batch for commands, a tools.write loop for the six files — and hands it to an executor; per the video's diagram, intermediate calls keep their logs and only the program's output returns to the model's history. The panel note says the full program is 543 lines; the replay shows the orchestration part. The left side is still writing files one by one.
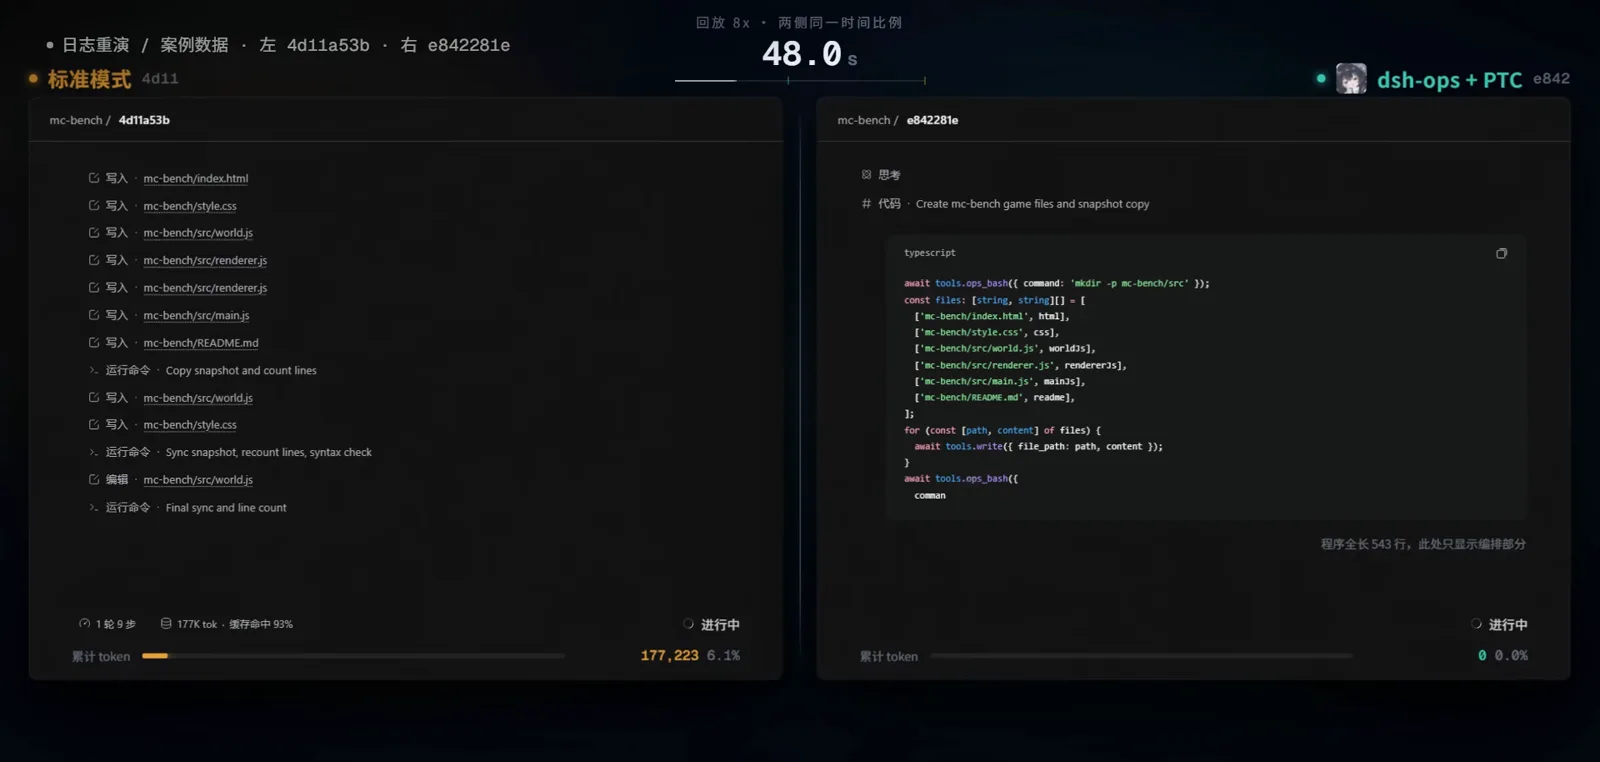
The PTC run writes one program (543 lines in full); intermediate calls stay in logs.Watch at 2:42
Part 3 · Reading the measured numbers
- 6
Same clock, different universes
At replay time 90.4s the right run is already done — 3 steps, 89.7s on the wall clock, 104,835 cumulative tokens (3.6% of standard), snapshot OK — while the left standard run is still in progress at 20 steps, 496,748 tokens, 17.1%. The finale: 70 steps / 198.4s / 2,905,841 vs 3 steps / 89.7s / 104,835, about 27.7x — the uploader's own measured comparison, worst (Windows PowerShell standard mode) against best (dsh-ops + PTC). His data card splits the credit: plain PTC alone about 9.4x (307,998), the plugin roughly another 2.9x.
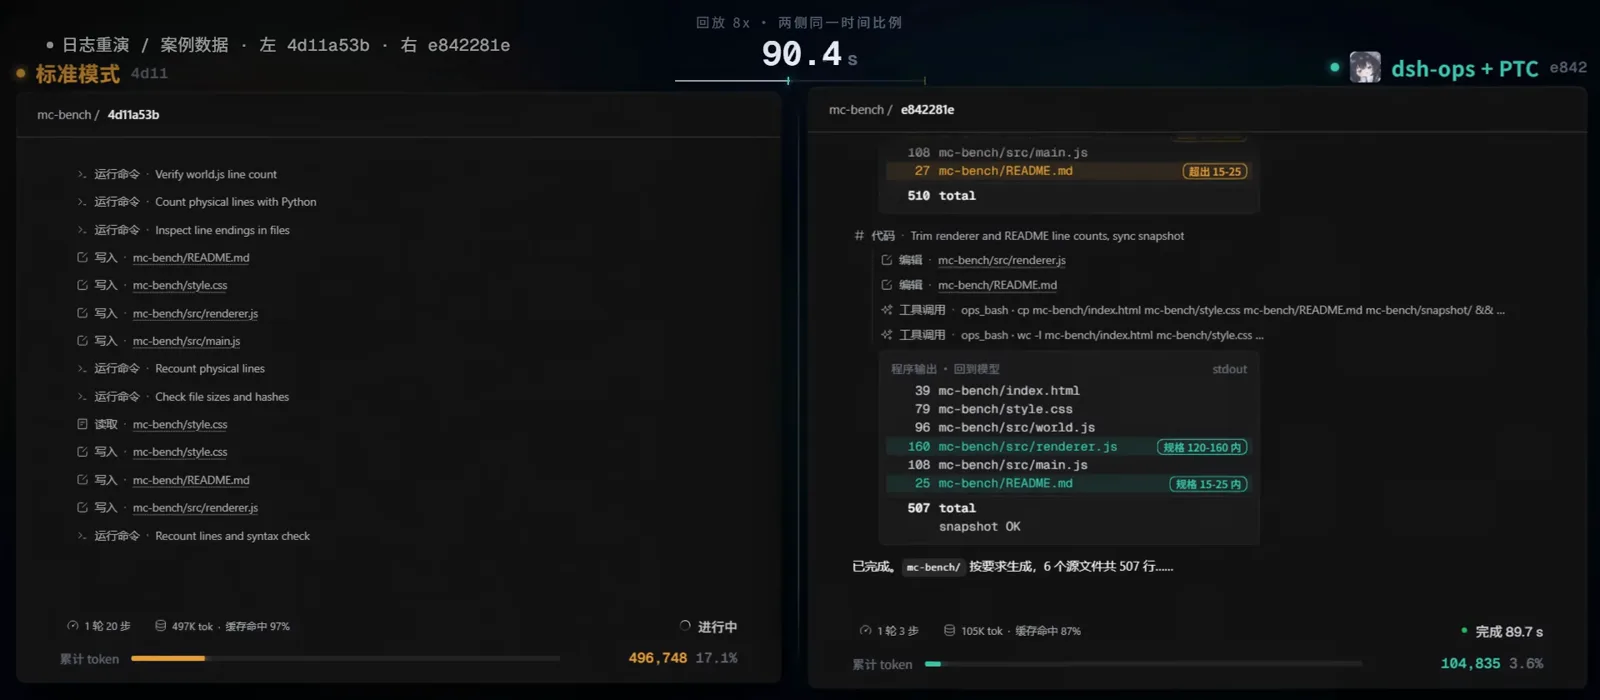
Right: delivered in 89.7s. Left: still running at 17.1% — the same replay clock.Watch at 2:47
FAQ
What people actually ask about dsh token cost — answered with the numbers this page can verify.
How do I save tokens in dsh (DeepSeek Harness)?
Three levers, biggest first. One: run mode — on the same task, plain PTC mode measured about 9.4x fewer tokens than standard mode, because the model writes a program and intermediate tool results stop flowing back into the context. Two: tool-call output — that is what dsh-ops tunes (batched commands, compact readbacks, a leaner tool surface), worth roughly another 2.9x on top in the same test. Three: context habits — compact early, write conclusions to files, start fresh sessions for new phases. To read the meters while you do this, open the usage-tracking guide.
What is dsh-ops?
A third-party performance-tool plugin for DeepSeek Harness by T-Auto (github.com/T-Auto/dsh-ops, ★1,379 as of the 2026-10-14 check; the repo link is self-reported in the video description, not independently verified). On Windows it ships standalone bash 5.3.15 and PowerShell 7.6.6 plus Rust-native file-search and batch tools, without touching your system terminal or PATH; its PTC-dedicated tools are off by default and must be enabled explicitly. v0.3.0 supports Windows x64 only and targets DSH 0.2.0-rc.2. The license field reads NOASSERTION — treat it as any other third-party plugin (see the safety guide).
Is the "27x token reduction" real?
It is the uploader's own measured comparison — quote it with its conditions. Same task, two runs: worst case, Windows PowerShell dsh standard mode, 70 steps / 198.4s / 2,905,841 tokens; best case, dsh-ops + dsh's PTC mode, 3 steps / 89.7s / 104,835 tokens. That is about 27.7x. The video's own data card splits it: plain PTC alone measured 307,998 tokens (about 9.4x), and the description credits dsh-ops with roughly another 3x. In the comments the uploader adds that exact savings are hard to quantify across tasks — what replicates reliably is fewer error loops and less over-thinking. The honest move is his: replay both modes on your own task and read your own meters.
How do I install dsh-ops?
Two ways per the README (as of 2026-10-14): search your DSH app's plugin market for the npm name dsh-ops, or run npx --yes dsh-ops@latest install --profile desktop (swap the profile name for web or tui). Check the result with npx --yes dsh-ops@latest status --profile desktop. You need Node ^22.19 || >=24 and, for v0.3.0, Windows x64; the target DSH should be 0.2.0-rc.2. Note the README's warning: if your registry has not synced the pinned platform packages, the installer exits 0 while silently skipping them — verify with status, and enable the PTC-dedicated tools explicitly afterwards.
What is PTC mode, and should I turn it on?
PTC (run_code) is a DSH run mode where the model writes a program and an executor runs it: intermediate tool calls keep their logs, but only the program's output returns to the model's history — exactly what the video's model → executor → tools diagram illustrates. Since the re-read loop is what makes standard-mode long tasks expensive, mode choice was the bigger lever in the test (about 9.4x versus the plugin's roughly 2.9x). It is an official DSH mode, not a plugin feature; dsh-ops adds its own PTC-dedicated toolset on top, which stays off until you enable it.
Can I cut token burn without any plugin?
Yes — the second video on this page is entirely about the problem without selling a fix, and its uploader's habits translate directly: write important conclusions to files instead of keeping them in chat, finish a phase and start a fresh session (he opens a new one around 300k tokens), compact early rather than trusting the ceiling, and stop re-reading large files you have already corrected. Those are context habits, not toolchain changes. The meters for checking whether it worked are on the usage-tracking guide; the compaction mechanics are on the context-compaction page.
Is it safe to install a plugin like this?
Treat dsh-ops as what it is: a third-party plugin that rewires low-level tool behavior. Its license field is NOASSERTION, the author identity rests on a self-reported repo link, and the field test covers one task on one Windows machine. Sensible precautions: snapshot or back up your workspace first, keep approval policies on while you evaluate it, check the repo's stars and activity yourself, and for anything that matters run a two-mode comparison like step 6 and keep whichever behaves. The safety guide covers sandbox tiers and approval settings.
Related guides
Neighbors in the cost cluster — and where each one's job ends.
Track dsh token usage & costs
The reading half of this page: usage meters, per-request receipts and cost structure — including the dsh-ops discussion data this page doesn't repeat. Read the bill there, cut the bill here.
Read the guideVisualize your dsh context window
The dsh-context plugin walkthrough: composition modal, per-request trend and the request browser that prices every piece of your context.
Read the guideContext compaction & long tasks
How the 80% trigger, /compact and tool-result pruning keep long sessions from falling apart
Read the guideRun dsh on free models via OpenRouter
Skip the DeepSeek key, add OpenRouter's :free models in settings, and verify the setup with a real README task — a screenshot-checked walkthrough.
Read the guideSwitch models & custom providers
Change models mid-session, add NVIDIA NIM or Ollama as a custom provider, and verify what you're really talking to.
Read the guideOllama & free models
Point DeepSeek Harness at OpenRouter free models or a local Ollama server and run sessions without a paid API key.
Read the guideSandboxes, approvals & secrets
The dsh safety model: three sandbox tiers, approval policies, guards, and where your secrets go.
Read the guideSources and credits
Both recordings are from Bilibili creators: every frame comes from 魔法师風雪's dsh-ops field test (the repo link is self-reported as GitHub T-Auto in the video description; identity not independently verified), while 兴趣使然的哲学爱好者's video is credited for problem evidence only — it is a slide-style explainer with no real UI, so it contributes zero frames. Every quantitative claim keeps its owner: token totals are the uploader's own measurements on one Windows machine, README percentages are the author's own benchmark, and view counts are Bilibili view-API values from the 2026-10-14 check.