
README
@tma1-ai/dsh-plugin-greptimedb




English | 中文
What a DeepSeek Harness run costs you in tokens, money, and time, written into GreptimeDB as OpenTelemetry traces, metrics, and logs.
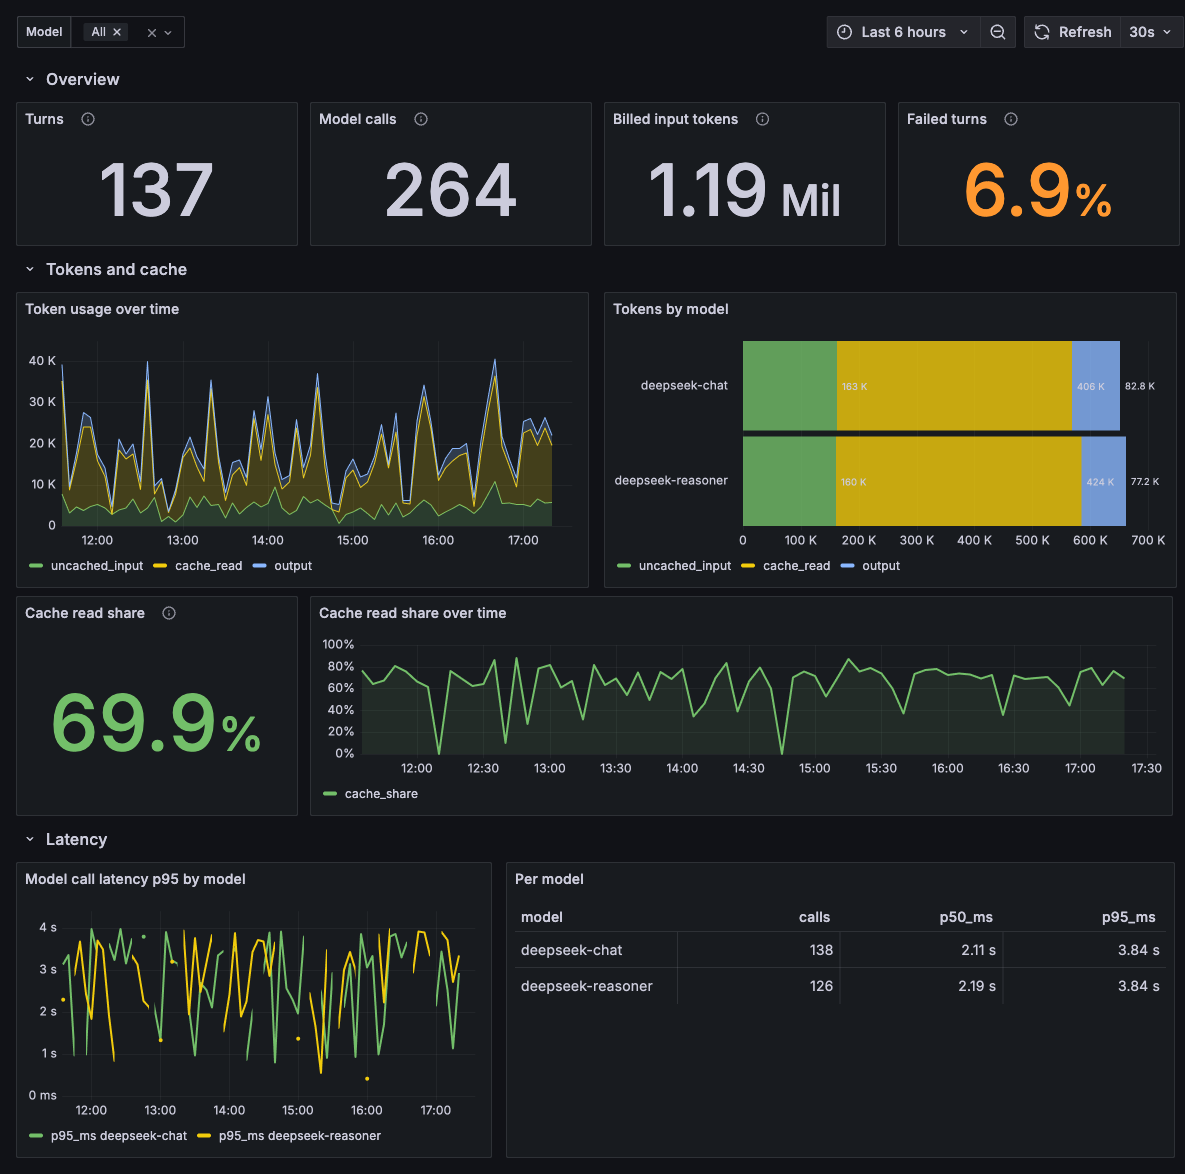
Seven Grafana dashboards read it back. No collector. No sidecar. No fork of DSH. It installs as an ordinary plugin, and every turn, model call, and tool execution becomes a row you can query:
-- Slowest tool calls, with the model that requested them.
SELECT span_name, model, duration_nano / 1000000 AS ms
FROM (
  SELECT span_name, duration_nano,
         MAX("span_attributes.gen_ai.request.model")
           OVER (PARTITION BY trace_id, "span_attributes.dsh.step") AS model
  FROM opentelemetry_traces
  WHERE "span_attributes.dsh.step" IS NOT NULL
)
WHERE span_name LIKE 'execute_tool%'
ORDER BY duration_nano DESC
LIMIT 10;
Quick start
Requires pnpm 10 or newer. dsh plugin forwards to whichever pnpm is on your PATH, and a dsh profile directory is its own pnpm workspace root. pnpm 9 refuses to install there and ignores the linker settings dsh writes.
Start the database and Grafana. The compose stack under grafana/ brings up GreptimeDB with the seven dashboards provisioned. Grafana reads those dashboards off disk, so fetch that one directory instead of cloning the repository:
curl -fsSL https://github.com/tma1-ai/dsh-otel/archive/main.tar.gz \
  | tar -xz --strip-components=1 dsh-otel-main/grafana
cd grafana && docker compose up -d
Install the plugin. Its defaults point at the database started above, so no configuration is required:
dsh plugin --profile web add @tma1-ai/dsh-plugin-greptimedb
The package ships a bundle patch, so that one command wires it into the profile.
Run DSH and check the data. Traces and logs are written within scheduledDelayMillis, 5 seconds by default; metrics on the next collection period, 30 seconds by default. DSH produces no data while idle, so run a task first:
dsh web
Grafana is at http://localhost:3000, with anonymous admin access enabled and no login required. Start with the Overview dashboard.
For the database alone, GreptimeDB's own console at http://localhost:4000/dashboard/ is enough to check the tables and run ad-hoc SQL:
docker run -p 127.0.0.1:4000-4003:4000-4003 \
  -v "$(pwd)/greptimedb_data:/greptimedb_data" \
  --name greptime --rm greptime/greptimedb:v1.2.0-beta.2 standalone start \
  --http-addr 0.0.0.0:4000 --rpc-bind-addr 0.0.0.0:4001 \
  --mysql-addr 0.0.0.0:4002 --postgres-addr 0.0.0.0:4003
Both bind port 4000, so run one or the other.
Compatibility
DSH package APIs change between prereleases, so each plugin release targets one DSH version:
| Plugin | npm tag | DSH |
|---|---|---|
0.1.0-beta.5 |
beta |
0.1.2-alpha.5 |
0.1.0-beta.4 and earlier |
latest |
0.1.1-rc.2 |
dsh plugin add with no version installs latest, which tracks DSH's own latest. Ask for the beta tag to follow the DSH alpha line — arguments are forwarded to pnpm add verbatim, so an exact version works the same way:
dsh plugin --profile web add @tma1-ai/dsh-plugin-greptimedb@beta
A mismatch is not a load failure. The plugin mounts, then drops every record with a greptimedb-otel: dropped a telemetry record warning, and the tables stay empty.
Configuration
To point the plugin at your own database, override the row in $DSH_HOME/profiles/<name>/cordis.patch.yml:
- id: greptimedb-otel
  name: '@tma1-ai/dsh-plugin-greptimedb'
  config:
    endpoint: https://<host>/v1/otlp
    database: <dbname>
    username: <user>
    password: <password>
A profile patch replaces the row's whole config instead of merging into it, so restate every field you want to keep.
| Key | Default | Notes |
|---|---|---|
endpoint |
(required) | OTLP base URL, e.g. http://localhost:4000/v1/otlp. The plugin appends each signal's /v1/{traces,metrics,logs} suffix; a per-signal path is rejected at load. |
database |
public |
Sent as X-Greptime-DB-Name. |
username / password |
(none) | Basic auth. Both or neither. |
signals |
all three | Any subset of traces, metrics, logs. A disabled signal builds no exporter. |
content |
none |
How much payload may leave the process. See What leaves the machine. |
serviceName |
dsh |
OTel service.name. |
logTable / traceTable |
GreptimeDB defaults | Destination table overrides. |
ttl |
180d |
Retention for the log and trace tables this plugin creates, sent as x-greptime-hints. Also accepts forever. GreptimeDB applies it when it auto-creates the table; an existing table keeps its own until ALTER TABLE. Metric tables are not covered — see Known limitations. Set it empty to send no hint and inherit the database default. |
shutdownTimeoutMillis |
3000 |
Deadline for the entire teardown sequence. |
metricIntervalMillis |
30000 |
Metric collection period. Must be at least exportTimeoutMillis. |
maxExportBatchSize / maxQueueSize |
512 / 2048 |
Batch and buffer bounds. |
scheduledDelayMillis / exportTimeoutMillis |
5000 / 30000 |
Export cadence and per-request deadline. |
更多「用量與計費」外掛
dsh-cost-meter
作者 han-1413141
DeepSeek Harness 會話與當日 API 費用、預算與官方餘額統計外掛:歷史看板、峰谷計價與官方價格一鍵同步。
dsh-usage-stats
作者 ychris12138
為 DeepSeek Harness Web GUI 提供提供方餘額、訂閱額度與 Token 用量分析。
dsh-plugin-langfuse
作者 linyp
Langfuse 可觀測性外掛:以 OpenTelemetry 追蹤樹匯出會話至 Langfuse OTLP 端點
dsh-token-usage
作者 laoyuehanni
貼近 DSH 原生設計風格的 token 用量統計外掛:即時記錄每次請求的用量與費用,在 Web UI 中提供趨勢圖表、按模型定價明細和供應商配額顯示。