
README
dsh-cost-dashboard
English | 中文
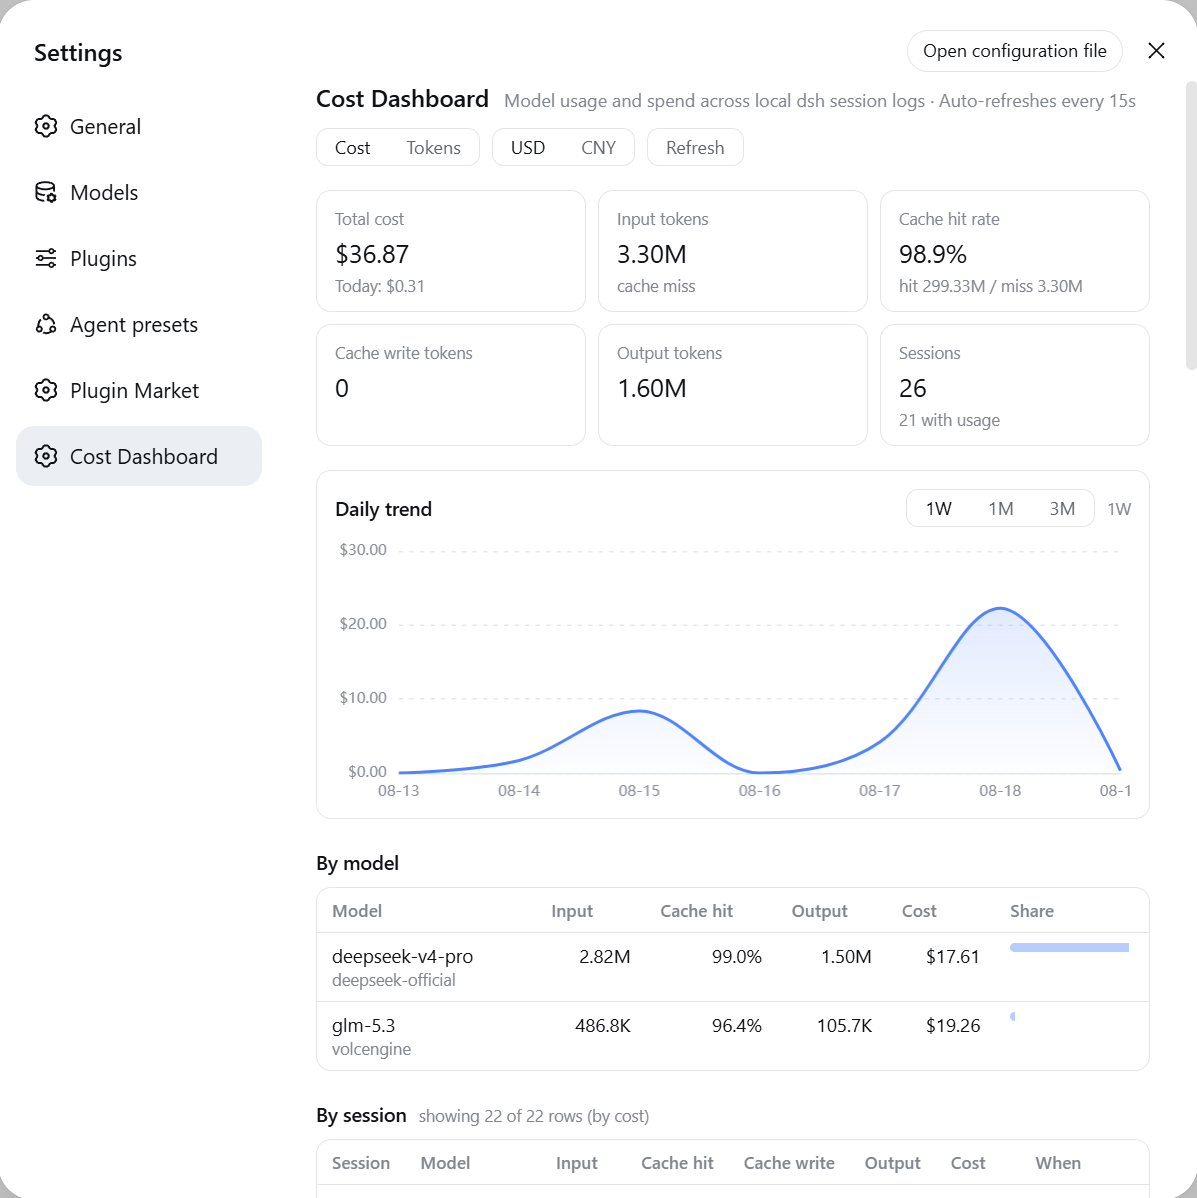
A cost-dashboard plugin for DeepSeek Harness (dsh): aggregates model input / output / cache token usage across all local sessions, prices it with a built-in table (including DeepSeek peak/off-peak time-of-day pricing), and renders a dashboard under Settings -> Cost Dashboard.
What you get
- Two entry points: Settings -> Cost Dashboard (the settings nav icons are hardcoded by the dsh settings shell, so plugins cannot customize them), plus a sidebar footer icon button (data-grid style) that opens the same dashboard in an anchored panel
- CNY only: every amount is shown in CNY (¥); entries listed in USD (imported catalogs, foreign models) convert at the configurable
fx.cnyPerUsdrate (default 6.79) - Summary cards: total cost, today's cost, input (cache-miss) / cache-read rate / output tokens, and the session count of sessions you started (subagent logs are folded in, not counted)
- Daily trend chart: ECharts smooth line charts (gradient area fill and hover tooltips); cost mode is a single CNY series, tokens mode splits into "input / output" and "cache read" charts on independent scales; selectable 1W / 1M / 3M ranges (default 1W)
- By-model table: tokens, cost, share per model
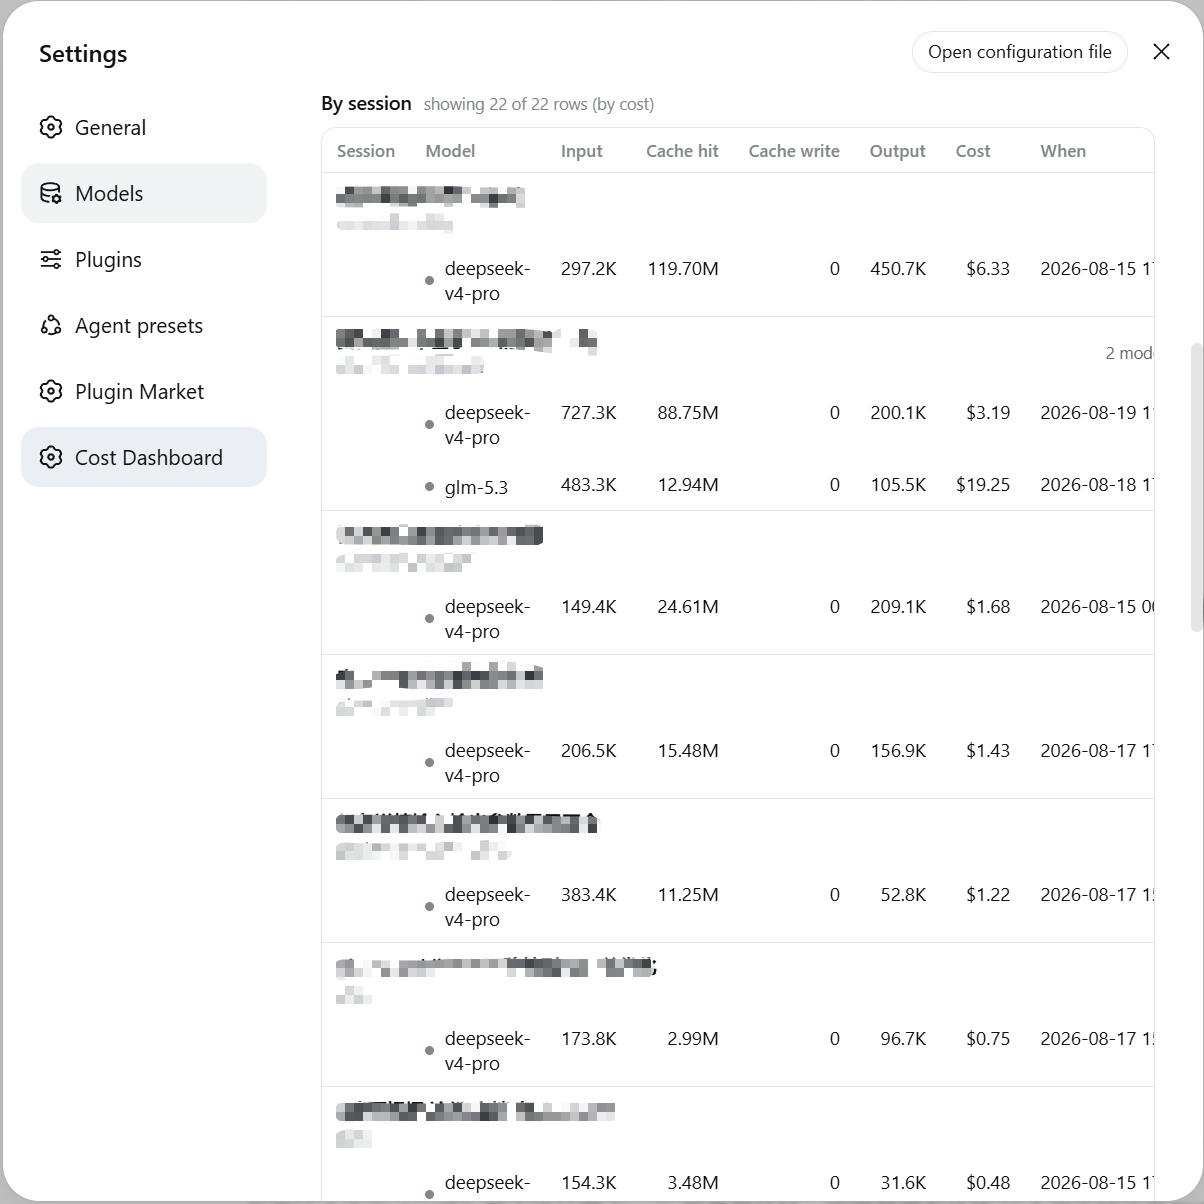
- By-session table: one row per session-model pair (a session that used several models appears on several rows, each with its own model, tokens and cost), with title, project directory, subagent badge for a session that spawned delegates. Sortable by cost or last-active time - click the Cost / When header, click again to reverse; the cap is applied per session, so a listed session never loses rows
- Pricing editor: edit the pricing JSON (including the FX rate) in-page; saves to
~/.dsh/cost-dashboard.json, effective immediately - Auto-synced catalog: fills in models missing from builtin/overrides from the LiteLLM price JSON (24h TTL + disk cache, degrades on network failure); never overrides builtin or hand-written prices
- Actual billing (optional): with read-only provider keys configured, shows DeepSeek/OpenRouter real balances and OpenAI/Anthropic real spend next to the estimate; domestic cloud vendors (Volcengine/Alibaba/Tencent) are not integrated - prices come from the config file
- Auto refresh: polls every 15s while open; the host re-reads only changed log files (mtime + size validated)
Install
dsh plugin --profile web add <spec>
<spec> may be a local path, an npm name, or a GitHub repo:
dsh plugin --profile web add /path/to/dsh-cost-dashboard
dsh plugin --profile web add github:mike-lee0120/dsh-cost-dashboard
dsh plugin add runs pnpm in the profile directory and automatically appends any dsh.bundle-declaring package to dsh.profile.bundles. Restart dsh web and refresh the page, then open Settings -> Cost Dashboard.
Remove with dsh plugin --profile web remove dsh-cost-dashboard.
Requires dsh 0.1.0-rc.7+ and Node >= 22.15 (the node:zlib zstd API the host itself relies on for session logs).
Data source and accounting
- Read-only scan of the current log generation inside
$DSH_HOME/sessions/*/*/(session.jsonl.zstd,session.vN.jsonl.zstd, or plaintext.jsonl); the numerically highest published generation wins, exactly as the runtime reads it, so a migrated session is never billed from its frozen older generation. Nothing is written, no projection touched. - Accounting mirrors the official
@deepseek-ai/dsh-token-metertokenUsageprojection:assistant/chunk {type:'usage'}is an early sample that survives a later request failure;assistant/messageusage (or the lastusagechunk of itsdata.stream) is the final sample for the same(turn, step)and replaces it instead of double counting, andllm/retry-startedcloses that slot so a retried attempt adds on top;assistant/attemptsettlements are billed even when no message followed;- four disjoint buckets: uncached input (DeepSeek
prompt_tokenswith cache hits subtracted), cache read, cache write, output. Cache write is still folded and still pricescacheWriterates, but no DeepSeek model produces that bucket, so the dashboard and its tables do not display it.
- Model attribution:
assistant/messagecarriesmessage.source.provider/model; a bare usage chunk (failed request) is attributed to the latestrequest/headermodel. - Session attribution: a subagent's log names the session that spawned it in its header (
parentSession), so its usage is folded into that session - the session table lists real sessions, each marked with how many subagents it absorbed. A log whose parent is missing keeps its own row and is badged as a subagent. - Mid-session model switches are split correctly.
- Run
node scripts/verify-totals.mjs: it reconciles against the officialsession_projcache.json(a point-in-time snapshot, so newer logs are skipped and said so), folds every selected log with the token meter's semantics, checks that a migrated session resolves to its highest format generation, and pins DeepSeek's official CNY rates plus the Beijing-time weekday peak window (an actively-writing session may drift by a live-write race, which is expected).
Pricing
Built-in pricing for 24 entries - 21 models plus three retired DeepSeek names - per 1M tokens, checked 2026-09-24; "hit" = cache-read rate, "write" = cache-write rate, defaults to the cache-miss input rate when unset. DeepSeek rates are the official CNY list prices (模型 & 价格); every other entry is shown in CNY after conversion:
CNY-listed models
更多「用量與計費」外掛
dsh-cost-meter
作者 han-1413141
DeepSeek Harness 會話與當日 API 費用、預算與官方餘額統計外掛:歷史看板、峰谷計價與官方價格一鍵同步。
dsh-usage-stats
作者 ychris12138
為 DeepSeek Harness Web GUI 提供提供方餘額、訂閱額度與 Token 用量分析。
dsh-plugin-langfuse
作者 linyp
Langfuse 可觀測性外掛:以 OpenTelemetry 追蹤樹匯出會話至 Langfuse OTLP 端點
dsh-token-usage
作者 laoyuehanni
貼近 DSH 原生設計風格的 token 用量統計外掛:即時記錄每次請求的用量與費用,在 Web UI 中提供趨勢圖表、按模型定價明細和供應商配額顯示。