
dsh-token-viewer
In a curated listMaintenance: Activeqwert702/dsh-token-viewer
Developer tool: live token usage & cost monitoring for DeepSeek Harness - consumed tokens for the current session and across all sessions, read from token-meter projections. No model calls.
$ dsh plugin add dsh-token-viewerInstall
dsh has no central install command — add this plugin’s entry (documented in its README) to your profile or patch config, then restart.
How installs work7
stars
0
forks
TypeScript
Language
MIT
License
2026-08-14
Created
2026-10-17
Last push
README
dsh-token-viewer
CC Switch-style token consumption statistics for the DeepSeek Harness Web GUI. Read-only surfaces over the harness's host-computed projections plus one balance read; the plugin adds no prompt content, tools, or provider requests.
Install (one command):
dsh plugin add qwert702/dsh-token-viewerRestart the harness, refresh the web page, then click the Token icon in the sidebar panel list; the account balance also shows up as a chip at the bottom of the sidebar.
Targets harness 0.2.0-rc.2 (and 0.1.6+ — slot names, projection APIs, and service contracts are unchanged between those releases; v0.3.0 switches to the loader-applied plugin Config export, the sanctioned config channel since the settings service became SettingsForms). Earlier versions of this plugin disabled the official ui-sidebar plugin and forked its sidebar.workspaces.header slot; that slot is gone in 0.1.6, so v0.2.1 and later no longer override any official plugin — it registers into the stock slots instead. On an older harness, pin v0.2.0. v0.4.2 re-verified on the 0.2.0-rc.2 dependency tree: node test/smoke.cjs and 48 component tests (vitest, 5 specs) pass, and node scripts/build-client.mjs rebuilds lib/ byte-identically.
Features
- Sidebar panel — a Token row in the sidebar's global panel list; clicking it opens the plugin's page in the main area: DeepSeek account balance (with refresh; error-retry when the host proxy fails) and aggregate consumption across all sessions, expandable to a per-conversation list.
- Balance chip — the sidebar footer carries the live account balance (full amount when the sidebar is wide, a bare currency mark on the collapsed rail); clicking it opens the statistics drawer.
- Whale-maid pet — a bottom-right pet showing the active pricing tier: asleep with a moon badge and rising Z's through the off-peak windows, awake with a lightning badge through the Beijing peak windows. The tooltip shows the tier, the countdown to the next window boundary, and the currently applicable flash prices; clicking the pet opens the statistics drawer, and the pet tucks itself away while the drawer is open.
- TokenDock — a slim live strip above the composer showing the current session's billed input (uncached + cache read + cache write), output, cache hit rate, and approximate context occupancy.
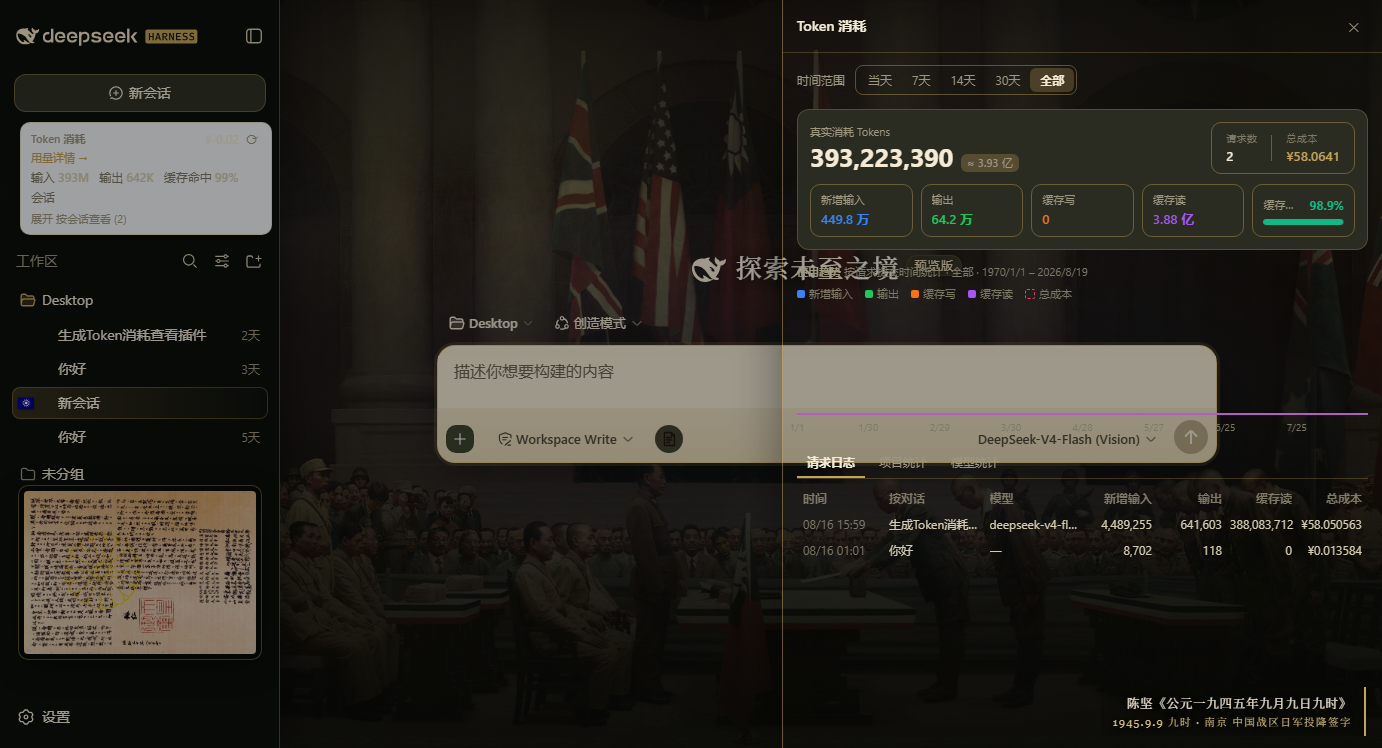
- Usage statistics panel (drawer in
shell.overlay, a faithful port of CC Switch's usage-dashboard method):- Per-request statistics — the host
usageLogprojection records one timestamped entry per reported assistant step (commit time, model, four token buckets); every figure folds these records, never cumulative session totals. The projection retains the newest 10,000 entries per session (stateVersion 2), so long-lived sessions stop growing the fold and the wire payload at that point. - Hero — real consumption (fresh input + output + cache write + cache read), request count, total cost, over a five-card breakdown row with a cache-hit-rate progress bar.
- Trend chart — requests bucketed by their own commit time (hourly for the day, daily otherwise, empty buckets zero-filled), four token series plus a dashed cost line.
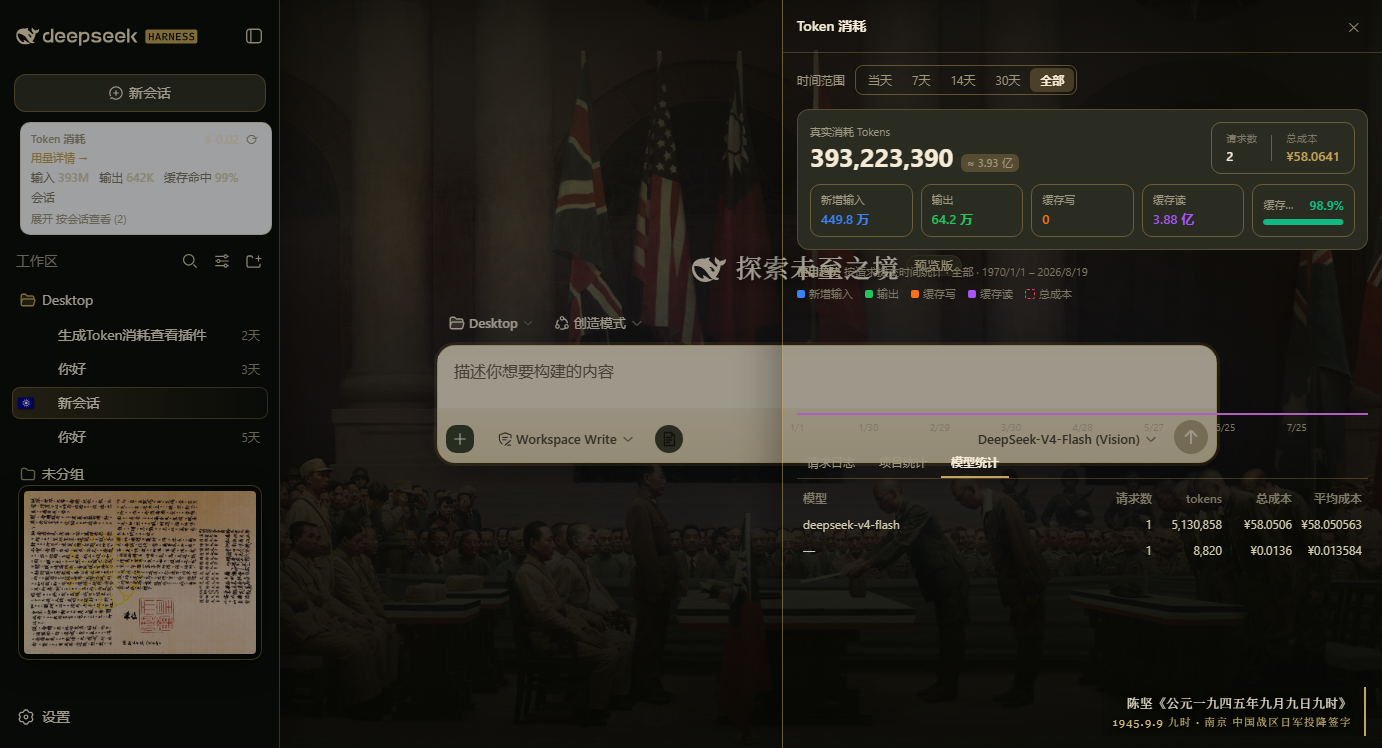
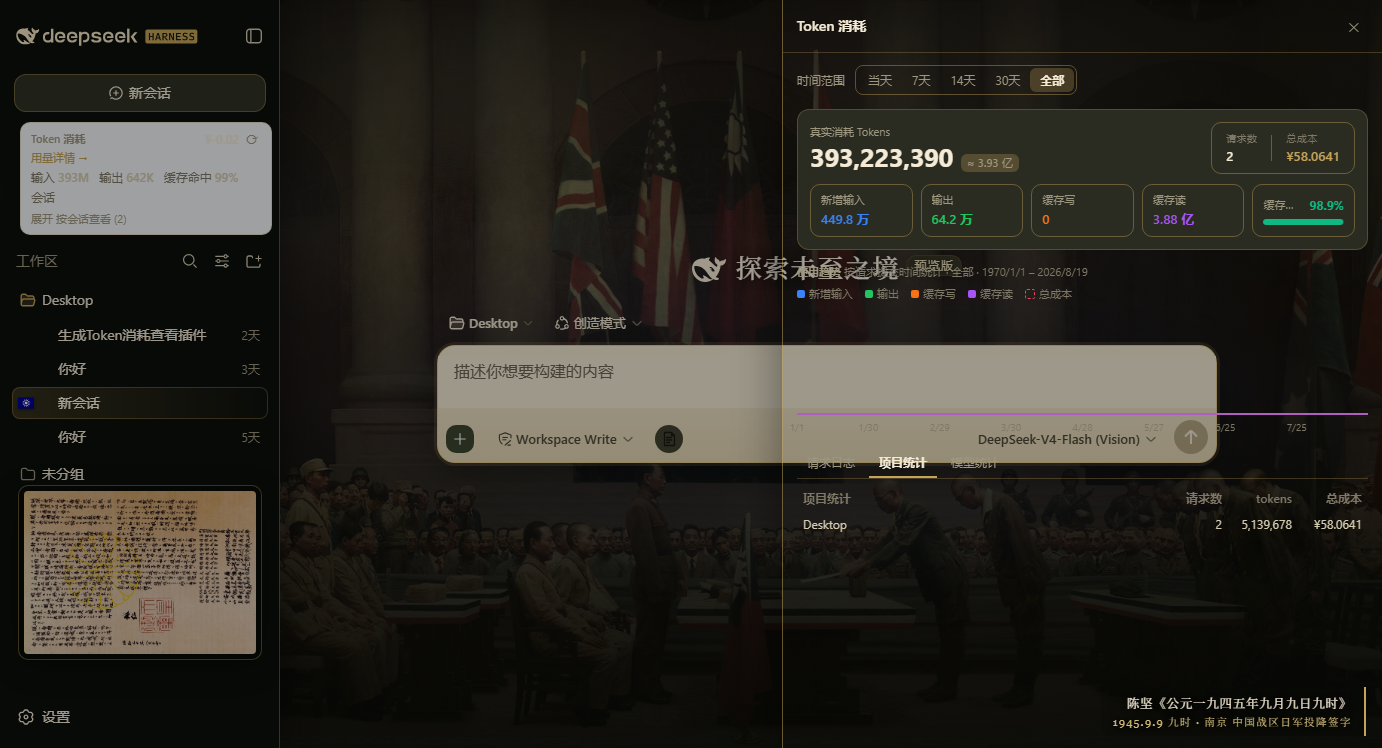
- Three tabs — request log (newest first; clicking a row opens that session), per-project statistics, and per-model statistics with average cost.
- Range presets — today / 7d / 14d / 30d / all, resolved exactly like CC Switch (local midnight of N−1 days back).
- Per-request statistics — the host
- Per-model peak/off-peak list pricing — every request bills under its own model's provider list price (V4-Flash / V4-Pro, CNY per 1M tokens, cache writes at the cache-miss rate), split by the provider's Beijing peak windows (09:00–12:00 and 14:00–18:00, double the off-peak rate); versioned model ids match by prefix, unknown models fall back to the V4-Flash off-peak table. Prices come from
GET /api/billing/pricing(fetched by the statistics drawer; the browser mirrors the built-in table as a fallback), andPRICING_FALLBACKin the host half holds the current list prices (see below). - Balance route —
GET /api/billing/balanceproxies DeepSeek's/user/balancethrough the harness credentials service; the API key never leaves the server. The credential reference (apiKeyRef, defaultDEEPSEEK_API_KEY) and provider base URL (baseURL) ride the plugin entry's config in the profile (defaults apply when unset).
Screenshots
Slot layout
Six registrations, all in stock slots (see src/client/index.ts):
| Slot | Surface | Id |
|---|---|---|
sidebar.panellist |
panel row + icon | token |
main |
panel page (its key must equal the row's id) |
token |
sidebar.footer.action |
balance chip | token-viewer-balance |
conversation.input.dock |
live token strip | token-viewer |
shell.overlay |
statistics drawer | token-viewer-detail |
shell.overlay |
whale-maid pet | token-viewer-pet |
Repo layout
More in Usage & Billing
dsh-cost-meter
by han-1413141
Cost tracking for DeepSeek Harness: session and model costs, token usage, budgets, provider balances, and coding-plan quotas. Bilingual English/Chinese UI.
dsh-usage-stats
by ychris12138
Provider balances, subscription quotas, and token-usage analytics for the DeepSeek Harness Web GUI (dsh web).
dsh-plugin-langfuse
by linyp
Langfuse observability for DeepSeek Harness (dsh): exports agent sessions as OpenTelemetry trace trees (GenAI semconv) to Langfuse's OTLP endpoint
dsh-token-usage
by laoyuehanni
按请求粒度记录模型 token 用量(按天 JSONL,首次启动自动补齐历史),Web 设置面板「Token 用量」统计页(GET /token-usage/stats 路由)