
dsh-bill
In a curated listMaintenance: Activejannchie/dsh-bill
DSH (DeepSeek Harness) plugin: per-session cost line + cost attribution report, priced by llm-pricing
$ dsh plugin add dsh-billInstall
dsh has no central install command — add this plugin’s entry (documented in its README) to your profile or patch config, then restart.
How installs work10
stars
8
forks
JavaScript
Language
MIT
License
2026-08-16
Created
2026-10-23
Last push
README
dsh-bill
English | 中文
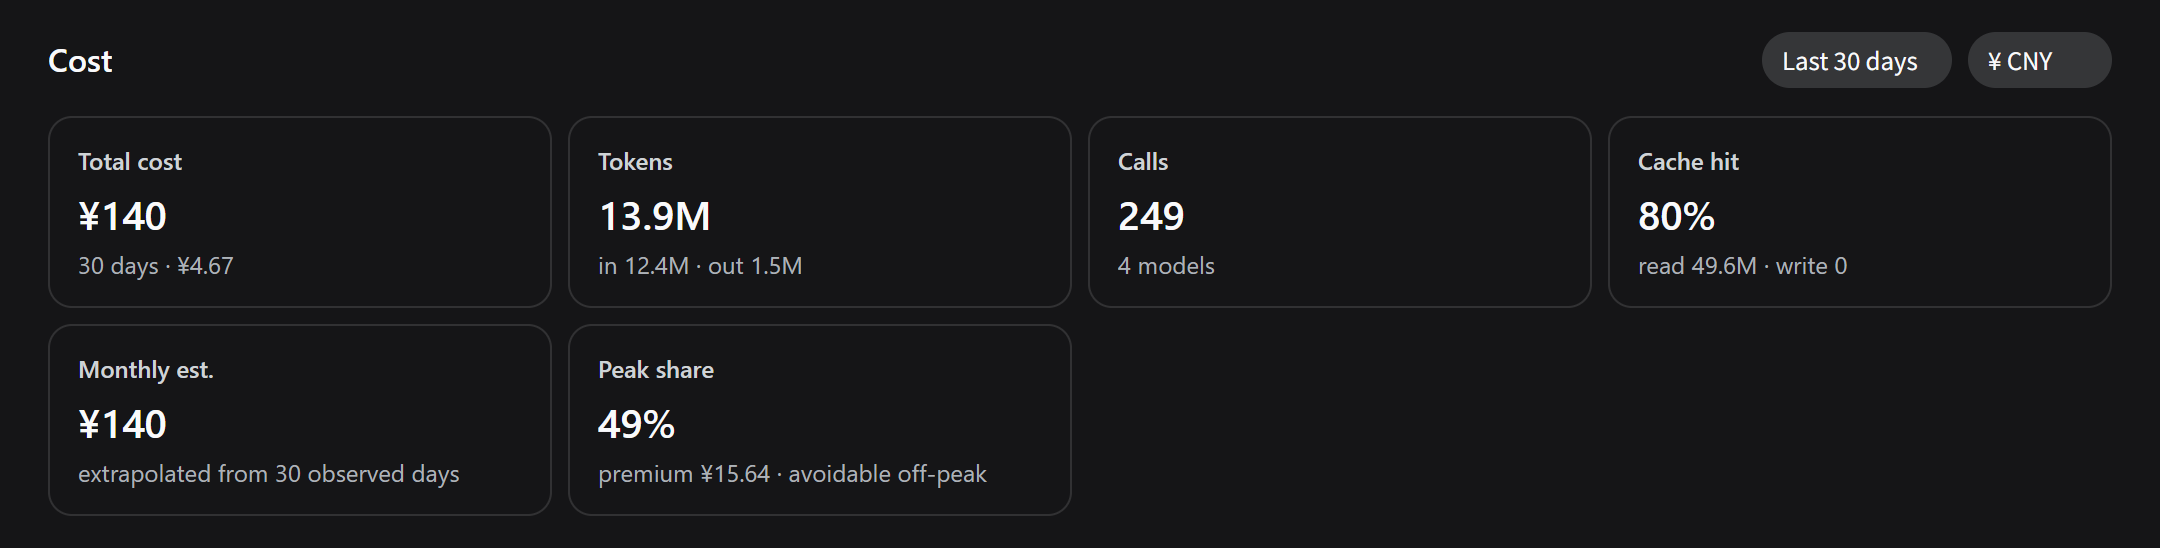
Cost tracking for DSH (DeepSeek Harness). A line under each turn tells you what that turn cost; the conversation's Cost tab tells you what that session's money went on, and the global Cost panel beside Plugins does the same for the whole account.


Install
dsh plugin --profile web add dsh-bill
Restart dsh web to pick it up.
Features
- Cost attribution — the bill split by kind of content: tool output, model output, system prompt, terminal commands (grouped by
git/pnpm/rg), tool input, attachments, system reminders, user input. The sunburst drills in. - Per-turn cost — one line under every finished turn: what it cost, how many steps, the cache-hit rate. It reads the session log itself, so turns from before you installed the plugin are covered too. A call a plugin makes on its own, outside any session (such as an auto-review before a tool call), belongs to no turn: it is in the account total and shows as a separate No session row in the per-session split, so the turn lines can add up to less than the account total.
- Always on screen — this session's cost as a pill beside the shipped stats in the composer dock, today's spend against the budget in the sidebar, and each session's cost in its sidebar hover card (DSH 0.1.7+). The dock's figure moves while a turn is still running, from the output that has streamed so far, and becomes the billed figure the moment the provider reports it. Each of the five surfaces — and the report's icon in the sidebar panel row — can be turned off individually in settings.
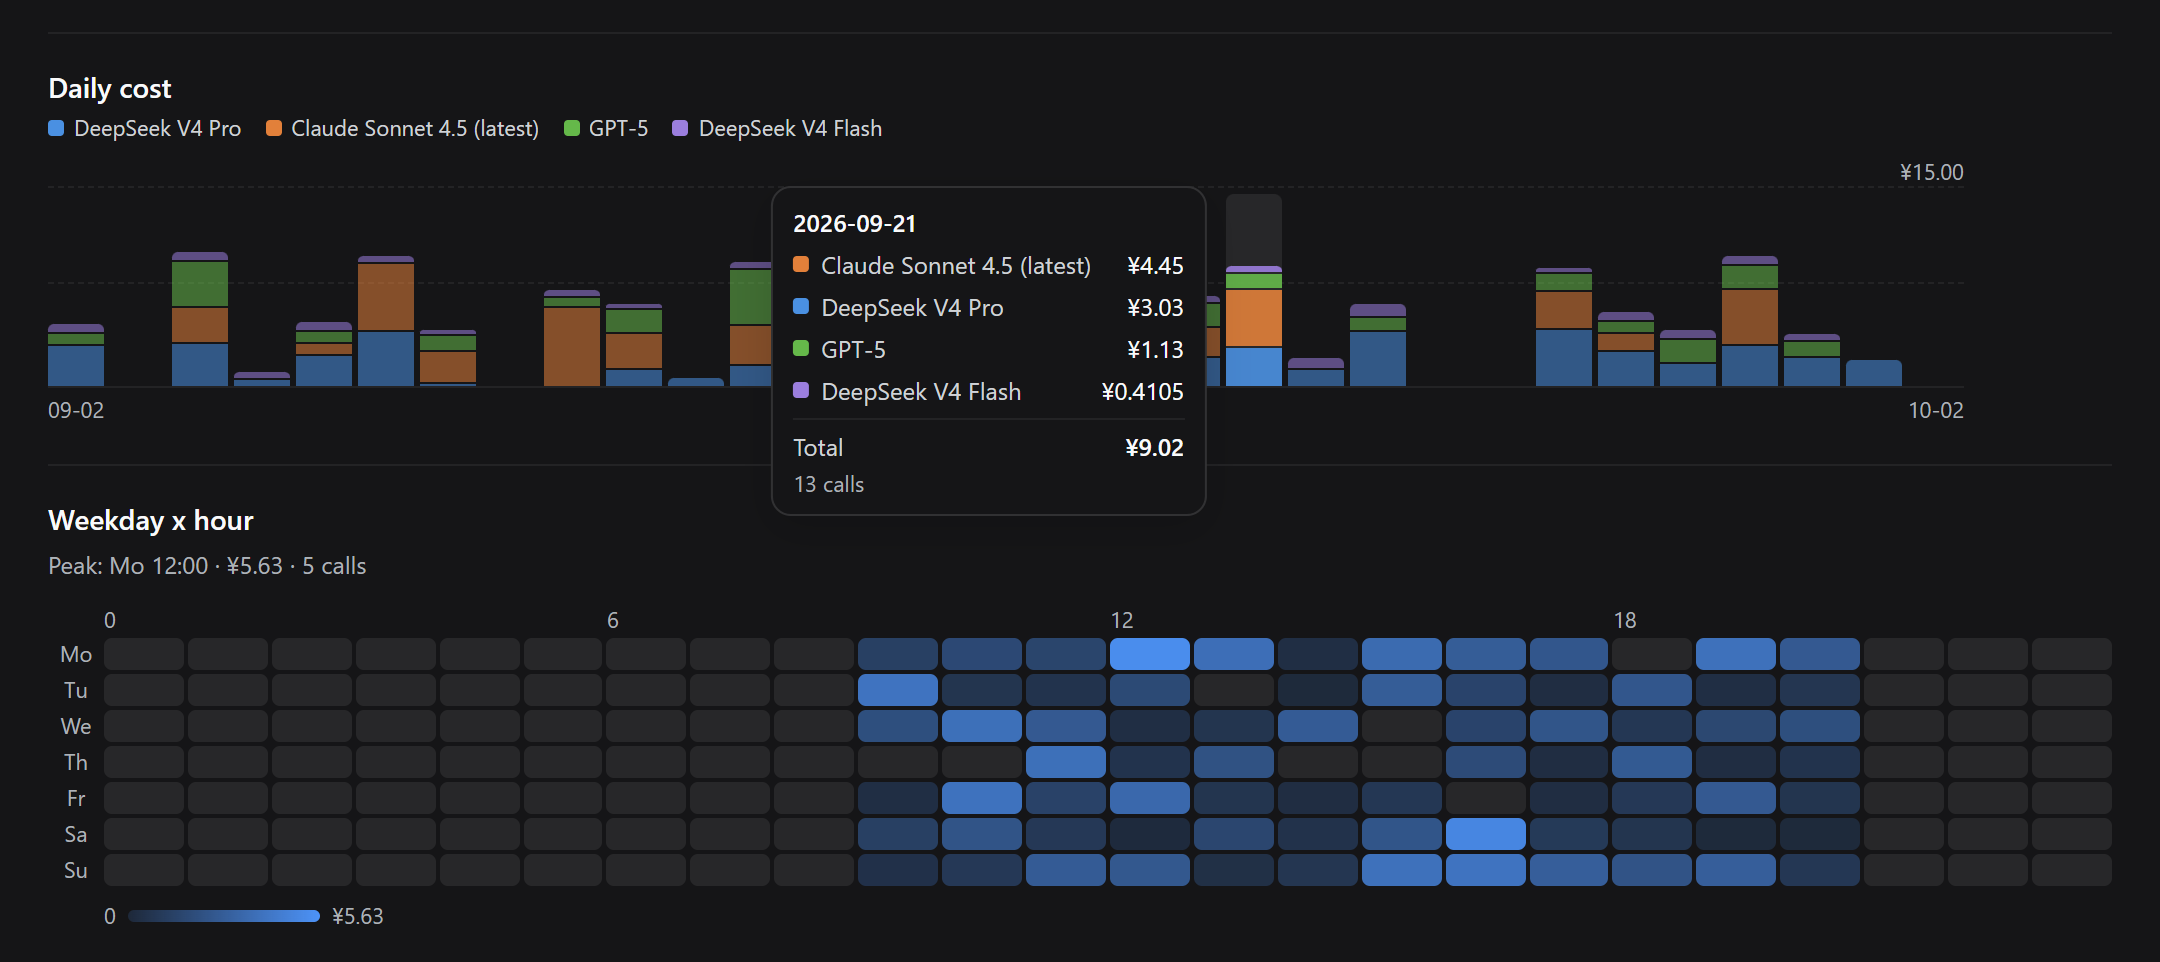
- Report — a Cost tab in each conversation (beside Chat and Trajectory) scoped to that session, and an account-wide Cost panel opened from the sidebar icon beside Plugins (DSH 0.1.7+): total, tokens, cache hit, peak share; account-wide also monthly forecast, account balance, budget and a per-session split; broken down by model and by purpose (including loop overhead such as context compaction); spend over time stacked by model, with each bar's split on hover; a weekday × hour heatmap. The window is either rolling (the last 24 hours, 7, 30, 90 or 365 days) or a calendar day (today, yesterday) on the host's clock, plus all time; bars are hours for a day or less, then days, weeks or months as the window grows.
- Budget — a daily / monthly / all-time limit that turns amber past 80% and red when you go over.
- Multi-currency — live rates for ~166 currencies; each model's base rate is shown in the currency its vendor prices it in.
- Agent tool —
bill_stats, so the model can answer questions about spend directly, over a number of days back or one calendar day (today,yesterday,YYYY-MM-DD).agentTool: falsein the plugin config leaves it unregistered, for anyone who never asks the model about spend and would rather not pay its schema on every request. - English and Chinese follow the DSH language setting; history from before the install is backfilled from the session log.
How it differs from similar plugins
Three substantive differences:
No hand-maintained price table. Every other plugin ships a built-in table of 2–4 DeepSeek models, which means no prices at all once you switch provider — and which is why they all need a "edit the price table by hand" entry point. dsh-bill pulls models.dev and OpenRouter through llm-pricing, covering 8000+ entries, so a new model is priced the day it ships.
Price is a timeline, not a number. The others compute a cost and store it (or recompute at today's price), so history goes wrong the moment a vendor changes its rates or a call crosses a peak/off-peak boundary. dsh-bill prices each call at that call's own instant, and never recomputes history.
It answers "on what". The others answer only "how much" — they consume the provider's aggregate token counts and never look at the request content. dsh-bill splits the request into classified segments at capture time and apportions cost by position in the cache prefix.
They do some things better: usage-stats reads balances and subscription quotas from 11 providers (dsh-bill only does DeepSeek), cost-meter can read OpenCode Go's subscription quota, and both surface more always-on entry points than dsh-bill does.
Point-by-point comparison (read from source, sampled 2026-08-16)
The sample is the cost-related plugins under the GitHub dsh-plugin topic with ★ ≥ 40, plus the four published to npm. Lower-starred plugins such as deepseek-harness-wallet were not checked individually.
More in Usage & Billing
dsh-cost-meter
by han-1413141
Cost tracking for DeepSeek Harness: session and model costs, token usage, budgets, provider balances, and coding-plan quotas. Bilingual English/Chinese UI.
dsh-usage-stats
by ychris12138
Provider balances, subscription quotas, and token-usage analytics for the DeepSeek Harness Web GUI (dsh web).
dsh-plugin-langfuse
by linyp
Langfuse observability for DeepSeek Harness (dsh): exports agent sessions as OpenTelemetry trace trees (GenAI semconv) to Langfuse's OTLP endpoint
dsh-token-usage
by laoyuehanni
按请求粒度记录模型 token 用量(按天 JSONL,首次启动自动补齐历史),Web 设置面板「Token 用量」统计页(GET /token-usage/stats 路由)