
DeepSeek Harness Token Usage & Cost Tracking
Seven screenshot-verified steps to read DeepSeek Harness token counts — in-session, in the log and on the provider's usage page — then four levers that cut the bill.
Last updated: 2026-09-13
DeepSeek Harness never hides what it spends: every session keeps a durable, append-only log of every prompt, tool call and reply, and the Web UI turns that log into numbers you can act on. With API prices back on the rise and prepaid credit running dry mid-search, reading those numbers is the difference between a manageable bill and a surprise.
This guide walks through the three layers of usage tracking — the Trajectory tab inside a session, the session log and status bar, and the provider's own usage page — then the levers that actually cut the bill: runtime modes, cheaper model tiers, and four community plugins that put cost dashboards straight into the sidebar.
Track and cut DeepSeek Harness token usage in seven steps
- 1
Open the Trajectory tab — your built-in usage ledger
Every dsh session writes an append-only log, and the Trajectory tab is where you read it back. Above the entries sits a Duration | Turns | Calls timeline with stacked Input, Model and Tools bars, so the rhythm of a long run is visible at a glance. The session status bar under the composer sums it up live: turns, steps, LLM time versus tool time, average TTFT, throughput, cache-hit rate, and input and output token counts.
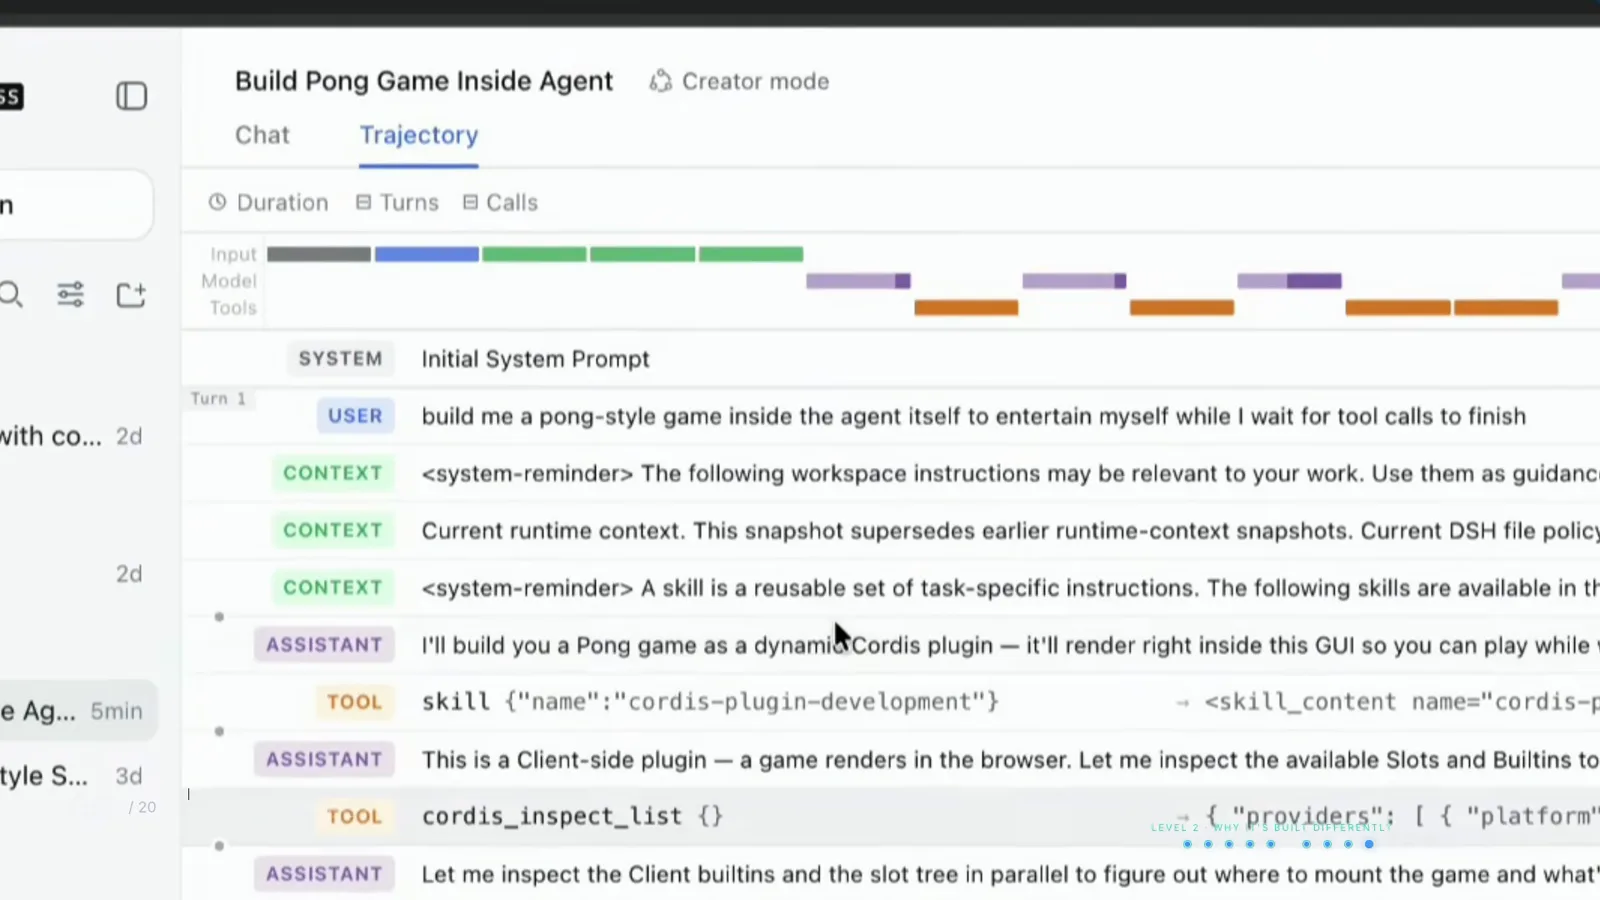
The Trajectory tab lays the whole session on one ruler — and every entry is clickable.Watch at 6:15 - 2
Click any entry for its per-request token receipt
Selecting an entry opens the Summary panel on the right. In this frame, Request #6 shows Status Completed, Tokens 100 tok, and a Request Timing block with a 19.9 s total duration, 16.8 s of TTFT, 3.04 s of generation and 32.9 tok/s of throughput. Few tokens with a long TTFT means the model was thinking, not spending — exactly what you want to know before blaming the bill.
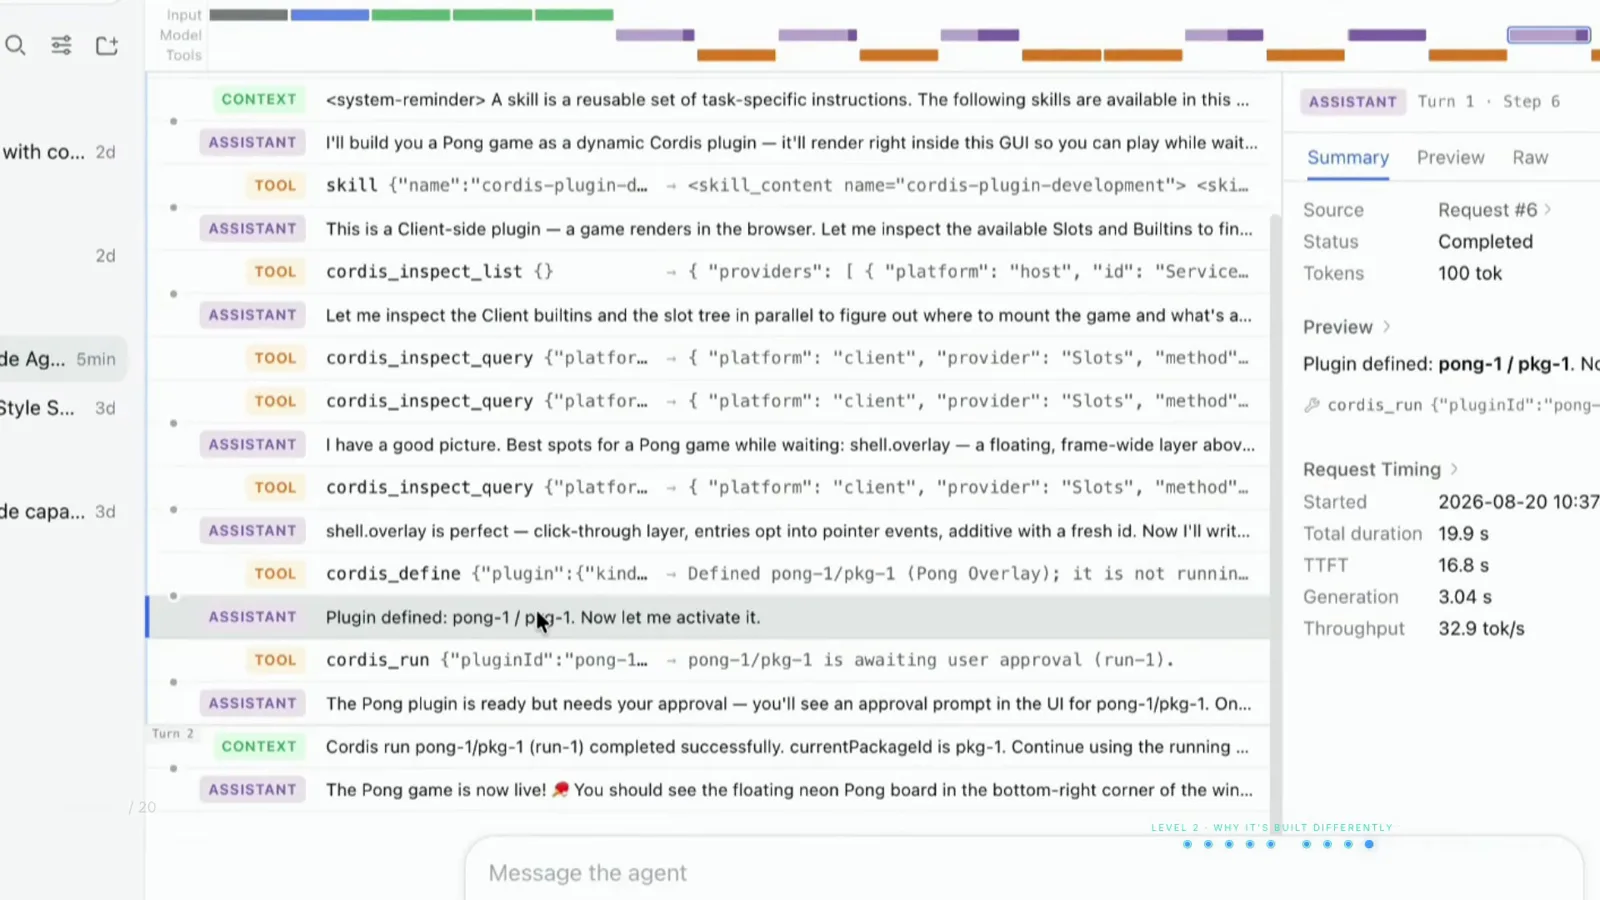
One click on any log entry yields that request's tokens, latency and throughput.Watch at 6:32 - 3
Find what actually ate your context
Scroll the log and the big consumers reveal themselves: runtime-context snapshots, the system-reminder skill lists injected at the start, and tool results pasted back mid-run. The log is never edited or overwritten — it is the receipt of everything the model saw, and the honest way to answer "why did this session cost what it cost?"
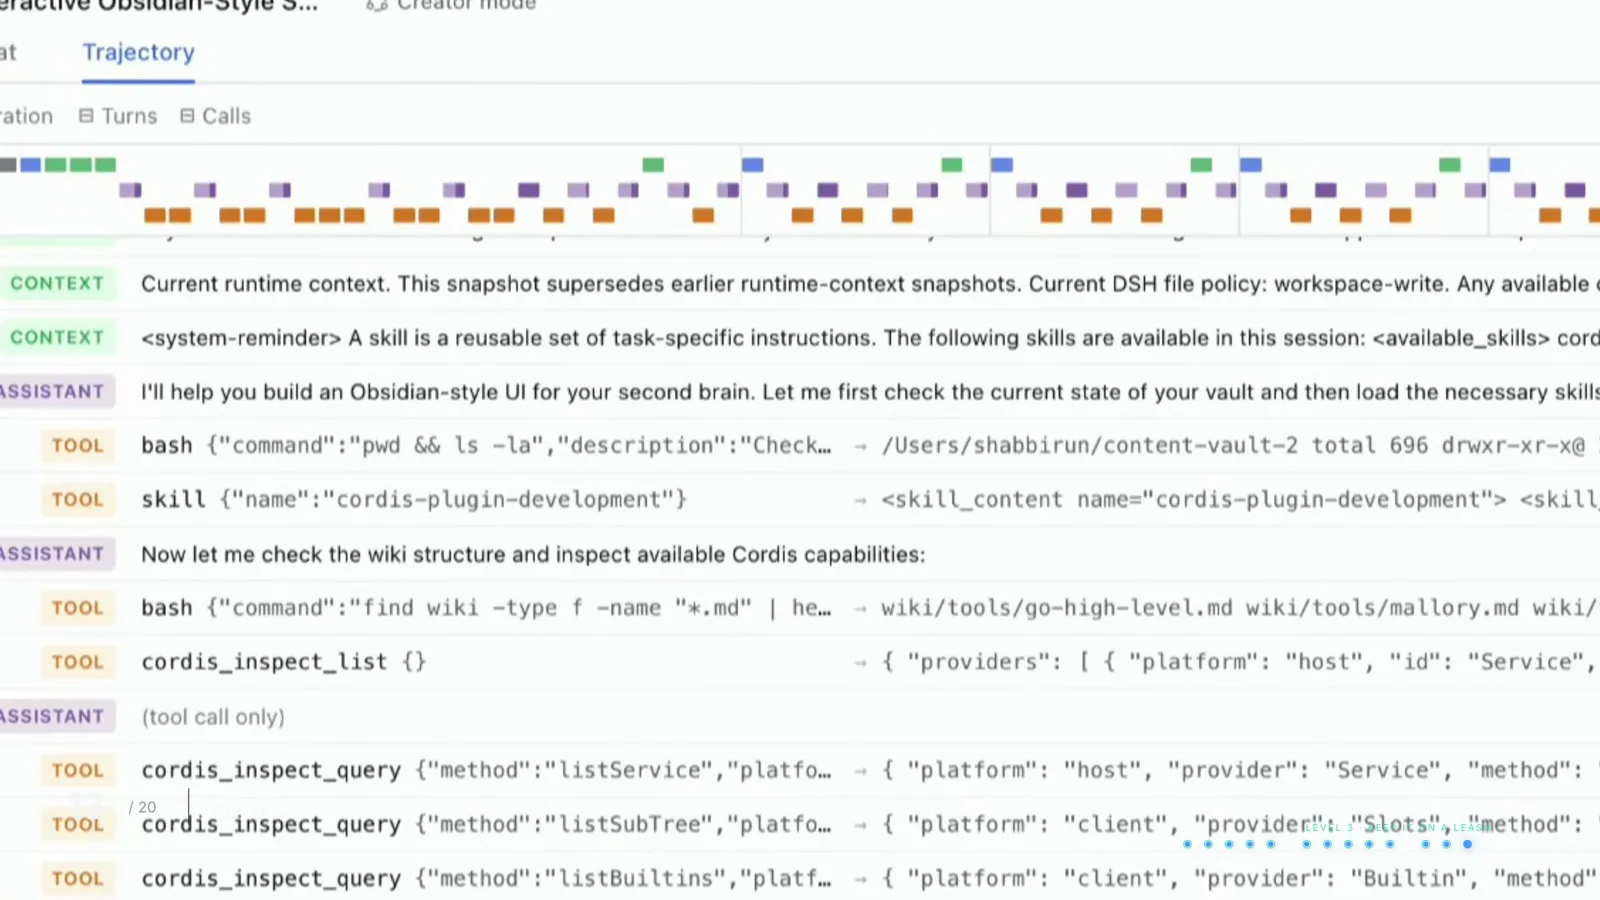
Context snapshots and tool results are the silent token eaters — this view names them.Watch at 9:30 - 4
Match the runtime mode to the job
The mode selector sits next to the workspace picker. Standard mode is the full kit; Code mode lets the model chain tools in one program instead of paying for a round trip per step; Minimal mode strips everything back to a terminal and a file editor for cheap, repeatable work. Same harness, three costs — and a lower effort level makes the model spend less time thinking on routine jobs.
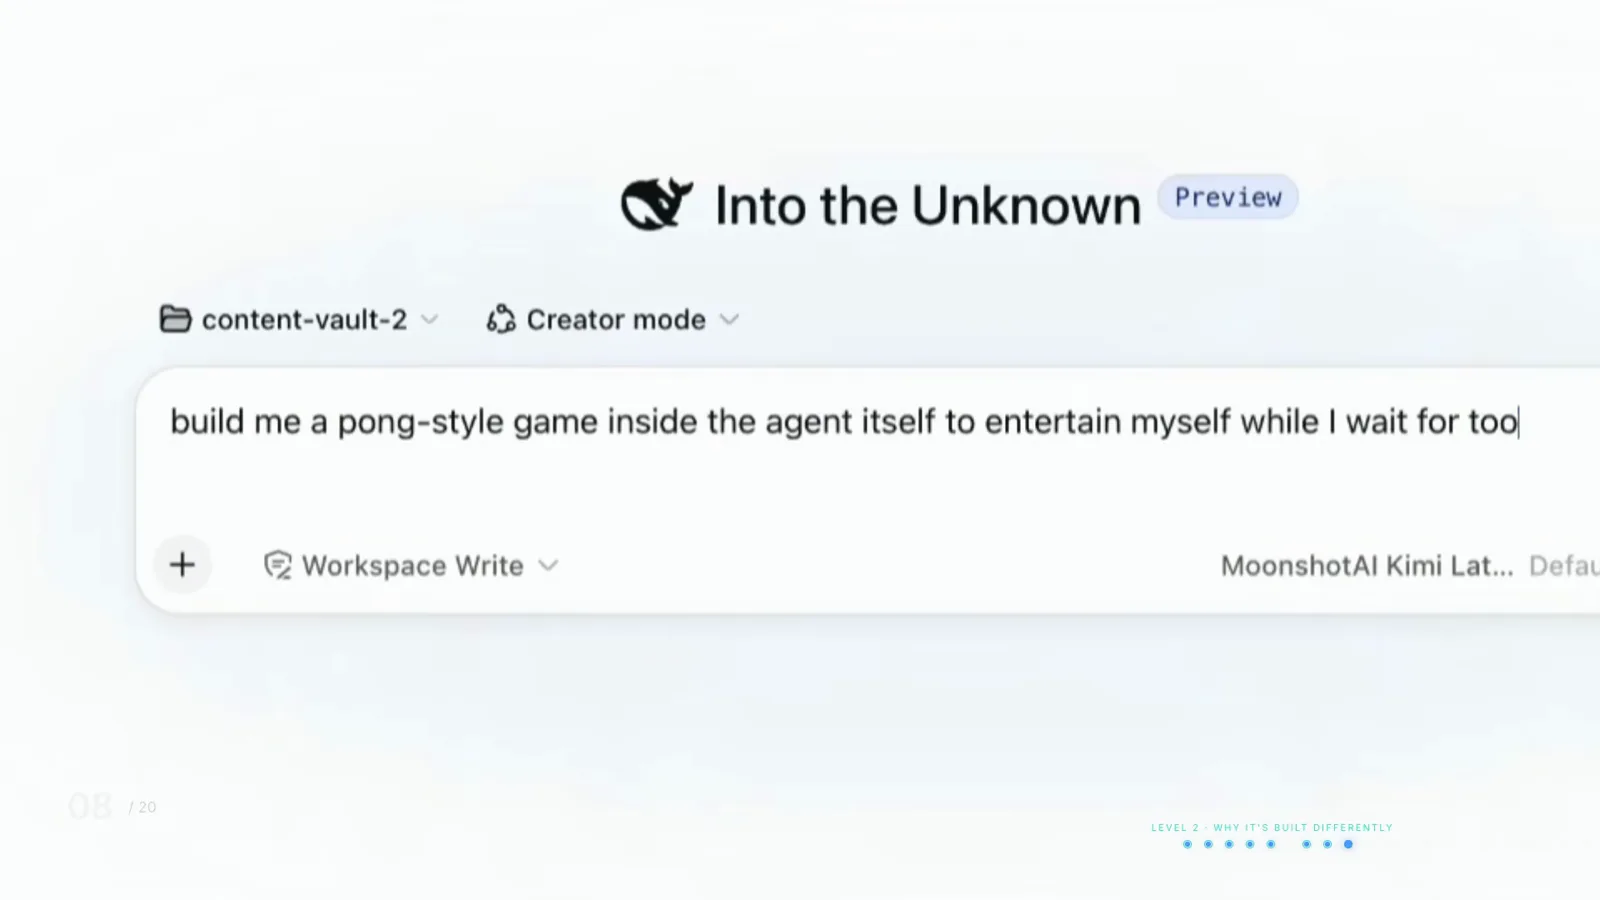
Mode, permission and workspace sit on the composer — the three dials that set a session's cost.Watch at 5:55 - 5
Drop a tier: cheap models for cheap work
The model picker groups models by provider — NVIDIA Nemotron, OpenAI GPT, MoonshotAI Kimi and more — and you can switch mid-session without restarting. Run routine edits on a flash-class model and reserve the expensive flagship for the few steps that need it; connecting OpenRouter (next step) widens the list so you can price-shop per task. Our switch-models guide has the full walkthrough.
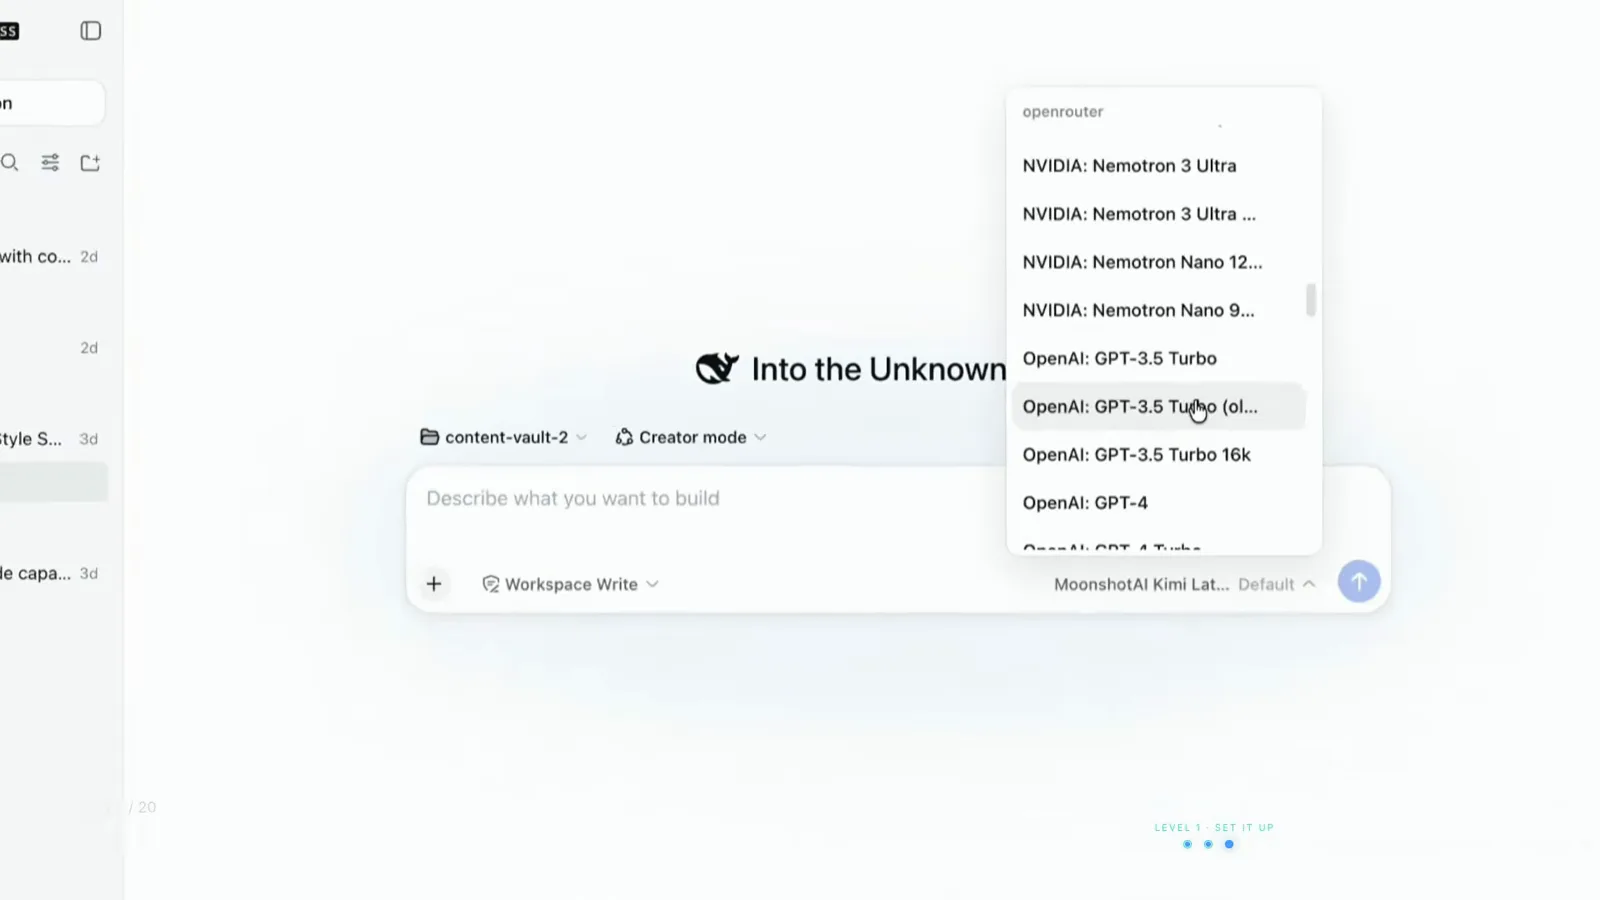
Provider-grouped model lists make downgrading a routine edit to a cheap tier a two-click job.Watch at 2:21 - 6
Reconcile with the provider's own usage page
Settings → Models shows who is serving your tokens: DeepSeek with a red dot when no key is set, a green dot once a provider is live. Then open platform.deepseek.com/usage — the official page totals Cost, API requests and Tokens over any window. In the source video, one month of agentic coding came to $3.39 for 88,585,433 tokens across 1,916 requests, with off-peak input rates at half of peak.
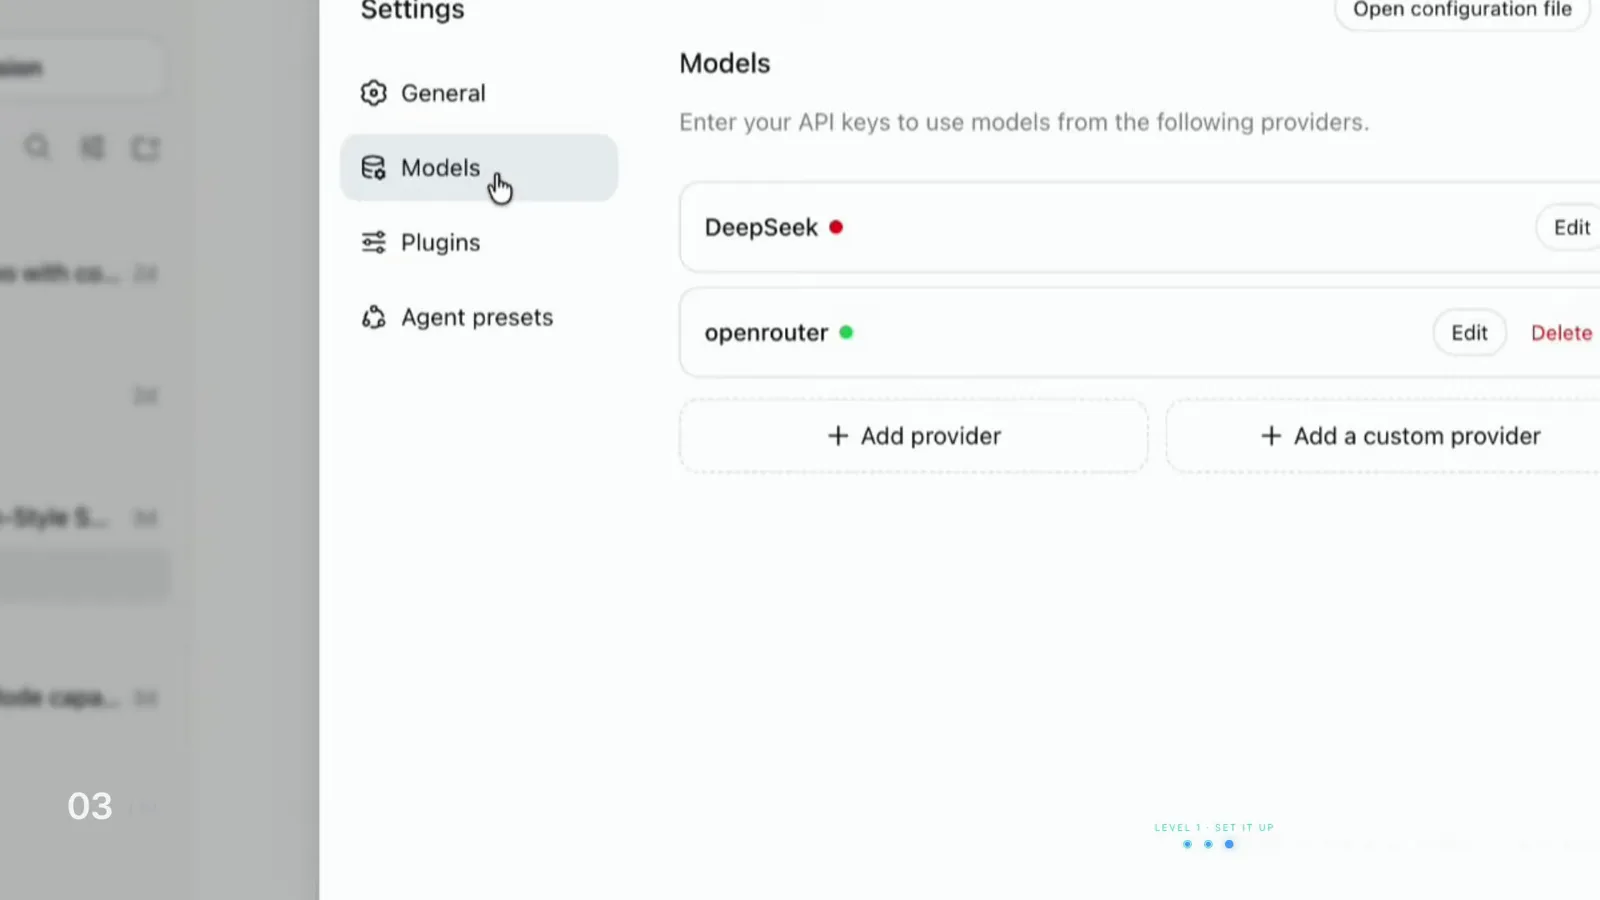
Green means live — the usage page numbers come from exactly these accounts.Watch at 2:02 - 7
Add a community dashboard for always-on numbers
The core UI counts per session; for budgets, balances and history across sessions, the plugin directory already has you covered — Settings → Plugins lists everything installed, including built-ins like session-persistence. The four picks below add context meters, cost badges and exportable ledgers without leaving the Web UI.
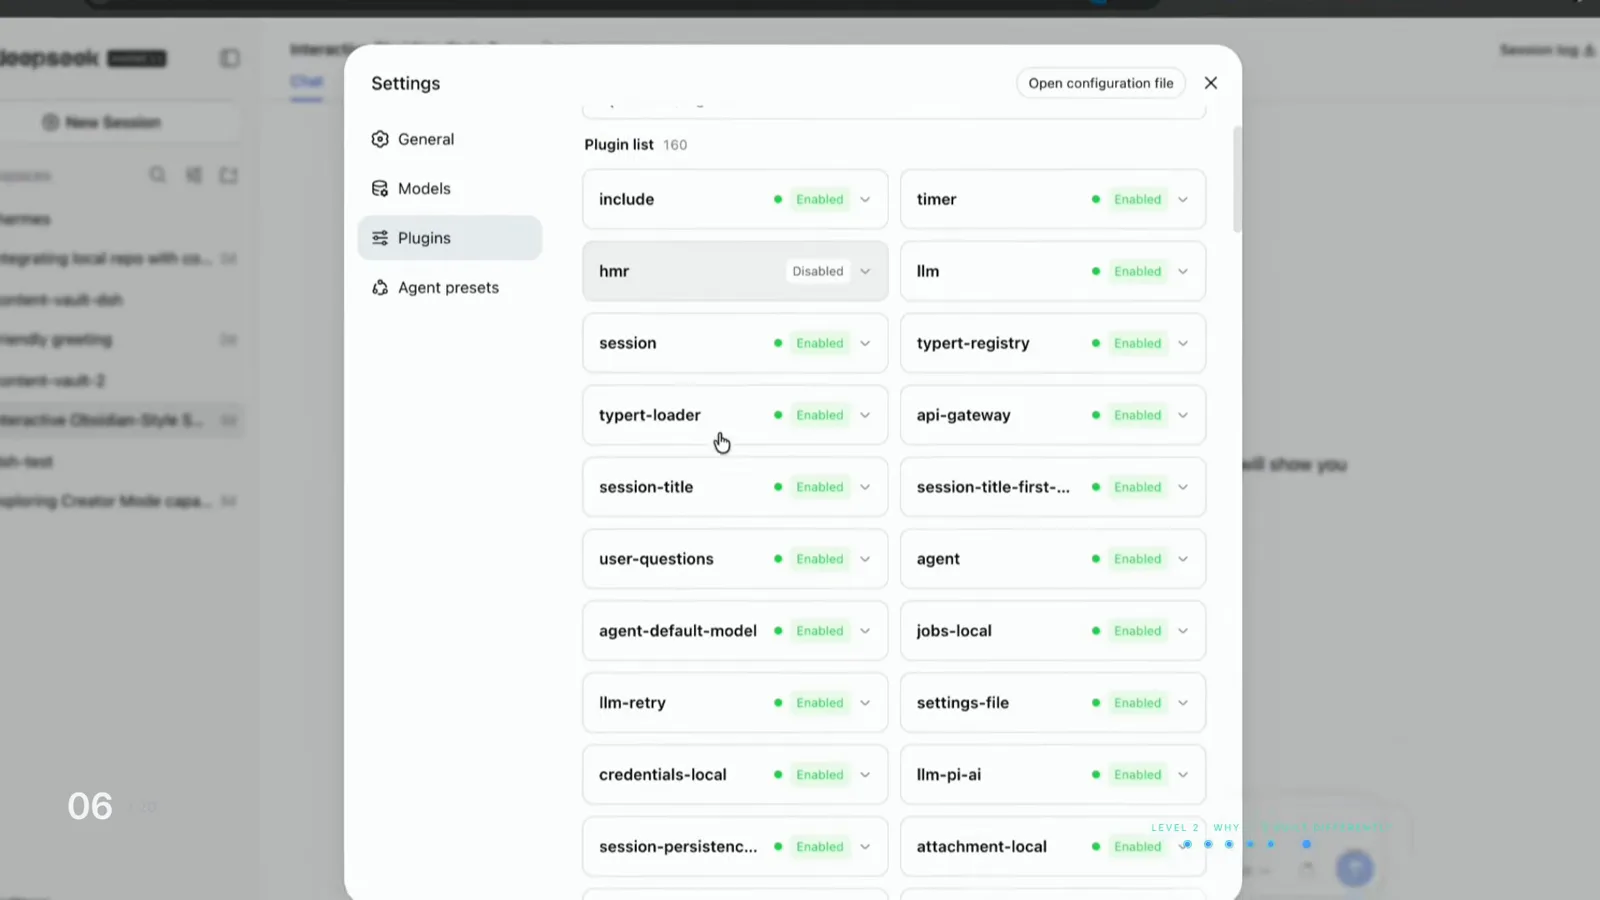
Installed plugins surface in Settings → Plugins — usage dashboards hook in right here.Watch at 4:24
Usage-tracking plugins worth installing
Verified picks from our directory that turn dsh's raw numbers into always-on dashboards. All free, all open source.
dsh-context
Adds a context dashboard tab and a /context command that break down exactly what fills the window — system prompt, tool schemas, messages, tool results — with remaining headroom.
Read the guidedsh-cost-meter
Session and daily cost badges, a budget meter with percentage, provider balance bars and a 26-week token-usage heatmap in the sidebar.
Read the guidetokenledger
Attributes token usage to the relay site that actually served each request, with per-project grouping, balances and CSV/JSON export — zero config.
Read the guidedsh-usage-stats
Provider balances, subscription quotas and token-usage analytics as cards in the dsh web sidebar.
Read the guideDeepSeek Harness token usage: FAQ
The questions people ask before they start counting tokens.
Does DeepSeek Harness show token usage natively?
Yes. Every session has a Trajectory tab with per-request token counts, timing and throughput, an Input/Model/Tools timeline, and a status bar under the composer that totals turns, steps, LLM time, cache-hit rate and input/output tokens for the session. The session header also carries a Session log button for downloading the raw log. Cross-session dashboards and budgets are what the community plugins add.
What do the token numbers actually count?
The session stats measure request pressure: everything sent to the model — system prompt, injected context, history and tool results — plus everything it replied. The cache-hit rate shows how much of that input was served from DeepSeek's prompt cache, which bills well below fresh input. The platform's own usage page splits input (cache hit), input (cache miss) and output.
When are DeepSeek's off-peak token prices in effect?
DeepSeek prices V4-Flash cache-hit input at $0.007 per 1M tokens off-peak versus $0.014 at peak, and output at $0.66 versus $1.32 — off-peak hours cost half the peak rate. The exact peak windows are published on the Models & Pricing page, so check them before scheduling long batch runs; the finance-agent source video halved its input bill just by working weekends.
Which DeepSeek Harness mode is cheapest to run?
Minimal mode, which strips the agent down to a terminal and a file editor, is the cheapest per turn for repetitive work. Code mode chains tools into one program, so a 30-step task costs one round trip instead of 30. Standard mode is the full toolkit and the priciest. Pair the mode with a Low reasoning effort for routine jobs and save Max effort for the hard steps.
Can a plugin show cost per session or per day?
Yes — that is exactly the gap the community fills. dsh-cost-meter adds session and daily cost badges, a budget meter and a 26-week heatmap; tokenledger attributes usage to the relay site that served each request and exports CSV/JSON; dsh-usage-stats surfaces provider balances and subscription quotas; dsh-context visualizes what fills the context window. All four are free and installable from the plugin directory.
Where is the session log, and can I export it?
The Trajectory tab reads back the durable, append-only log that every session writes — nothing in it is edited or overwritten. The session header has a Session log button that downloads the log, so you can analyze tool calls and token counts offline; that is exactly how the finance-agent source video audits its own runs.
Related guides
Cost control doesn't stop at reading the numbers.
Switch Models in DeepSeek Harness
Wire any provider or a local Ollama, then swap models mid-session — the fastest cost lever once you can read the usage numbers.
Read the guideRun Local Models with DeepSeek Harness
Take the per-token bill to zero by pointing dsh at Ollama or vLLM on your own machine.
Read the guideUpdate DeepSeek Harness Plugins
Keep your usage dashboards and other plugins current without breaking sessions.
Read the guideDeepSeek Harness Plan Mode
Make the agent state its plan before it spends a single token on the wrong path.
Read the guideInstall DeepSeek Harness Plugins
The step-by-step for adding plugins — including the usage trackers featured on this page.
Read the guideReplay & review your dsh sessions
Open the trajectory viewer, read structured receipts, locate failures by turn and branch a new chat from any step — illustrated walkthrough
Read the guideSources & credits
Screenshots come from Shab Noor's clean screencast; the session status bar, platform usage page and pricing figures were verified in David Arias's finance-agent walkthrough. Every image deep-links to the exact moment in its source video.