
Let dsh take over the browser: a browser MCP field walkthrough
The mcp__browser toolset, an authorized test range, and 11 frame-by-frame steps deep-linked to the source recording.
Last updated: 2026-10-04
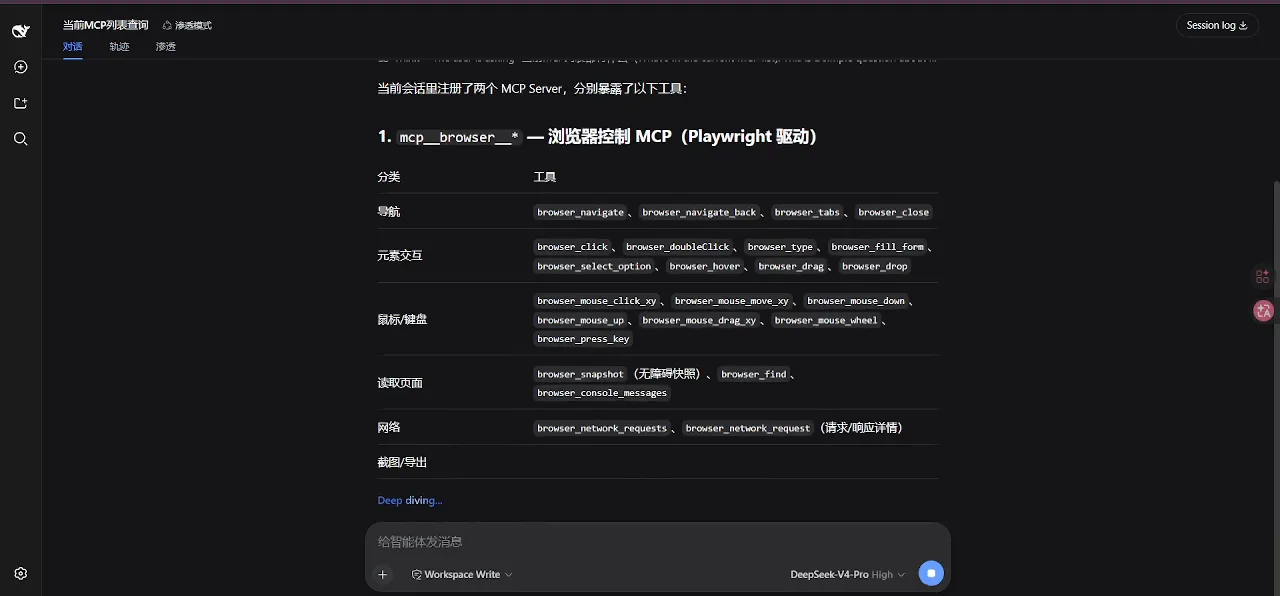
What dsh gains from a browser MCP is not screen-guessing — it is a real browser, Playwright-driven, mounted as native tools. Once connected, names like mcp__browser__browser_navigate, browser_click, and browser_snapshot appear verbatim in the session tool list, and dsh uses them to navigate, click, fill forms, open tabs, and read network traffic.
This page dissects one unusually clean screen recording: the uploader runs dsh against an authorized vulnerability range, from tool mounting to the final report. If you have never wired up MCP, start with the MCP setup basics; this page focuses on the capability surface and what a real run looks like. MCP setup basics
TL;DR
- ▸A browser MCP gives dsh hands on a real browser: navigation, clicks, form fills, accessibility snapshots, and network reads, organized in six tool groups.
- ▸The field test runs on an authorized range: intent-driven orchestration, autonomous tabs, verified findings, and a downloaded evidence archive.
- ▸The tool-list frame anchors this page: browser_navigate, browser_click, browser_snapshot and friends under the mcp__browser__* prefix.
- ▸Boundaries come first: web automation is not a master key — respect site terms and the law, and think twice before mounting a browser that carries your logins.
From tool list to final report, step by step
Capability surface: what a browser MCP adds to dsh
- 1
Read the tool list — dsh's verbs for the web
This frame is the page's key: the mounted browser MCP lists its tools under the mcp__browser__* prefix in six groups — navigation (browser_navigate, browser_navigate_back, browser_new_tab, browser_tabs, browser_close), element interaction (browser_click, browser_getClickable, browser_input, browser_type, browser_fill, browser_selectOption, browser_hover, browser_drag), mouse emulation (browser_mouse_click_xy, browser_mouse_move_xy, browser_mouse_scroll, browser_screenshot_xy, browser_screenshot_ele), reading and verification (browser_snapshot with its accessibility tree, browser_find), network (browser_network_requests, browser_network_response — these need manual approval), and tab scripting (browser_tabs_executeCode, browser_tabs_script). Understand these six groups and you understand what dsh can do in a browser.
Read it closely — these tool groups are dsh's vocabulary for the webWatch at 1:52 - 2
See where the tools run: the session shell
The recording's session is named for a web takeover demo, runs with one subagent in pentest mode, and splits its UI into conversation, trace, and security tabs beside a session log. Think and Deep diving markers show dsh planning on its own instead of waiting for instructions — that is the difference between takeover and question-answering.
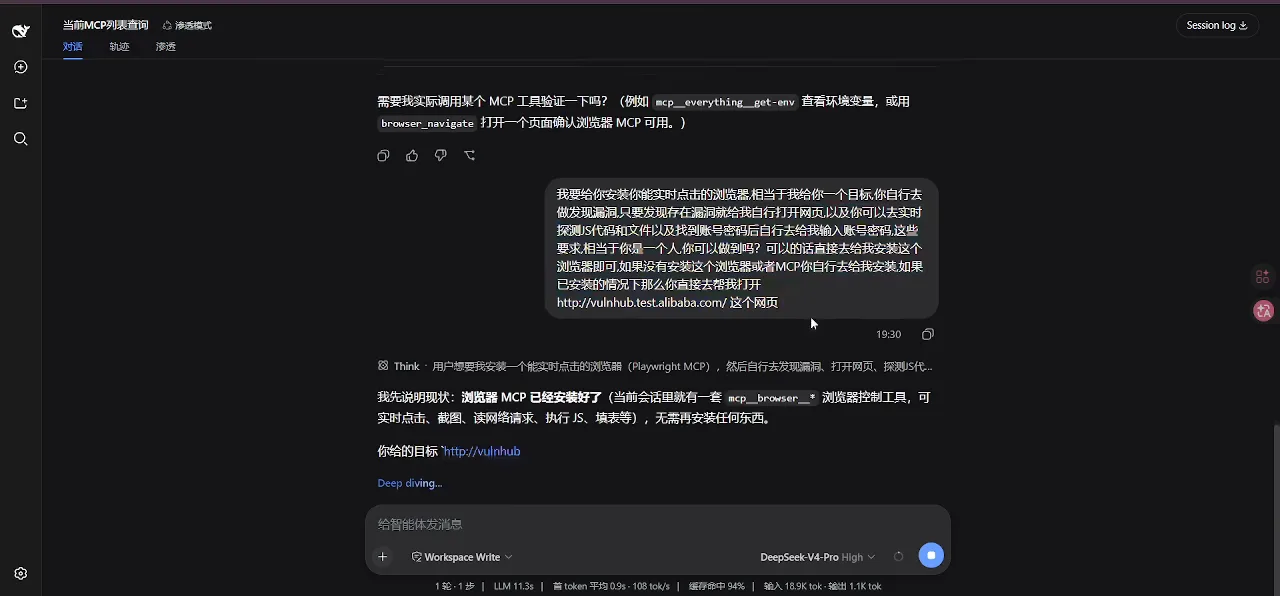
Session "web takeover demo": pentest mode, one subagent, three tabsWatch at 2:30
Field test: automation on an authorized range
- 3
Watch intent-driven orchestration begin
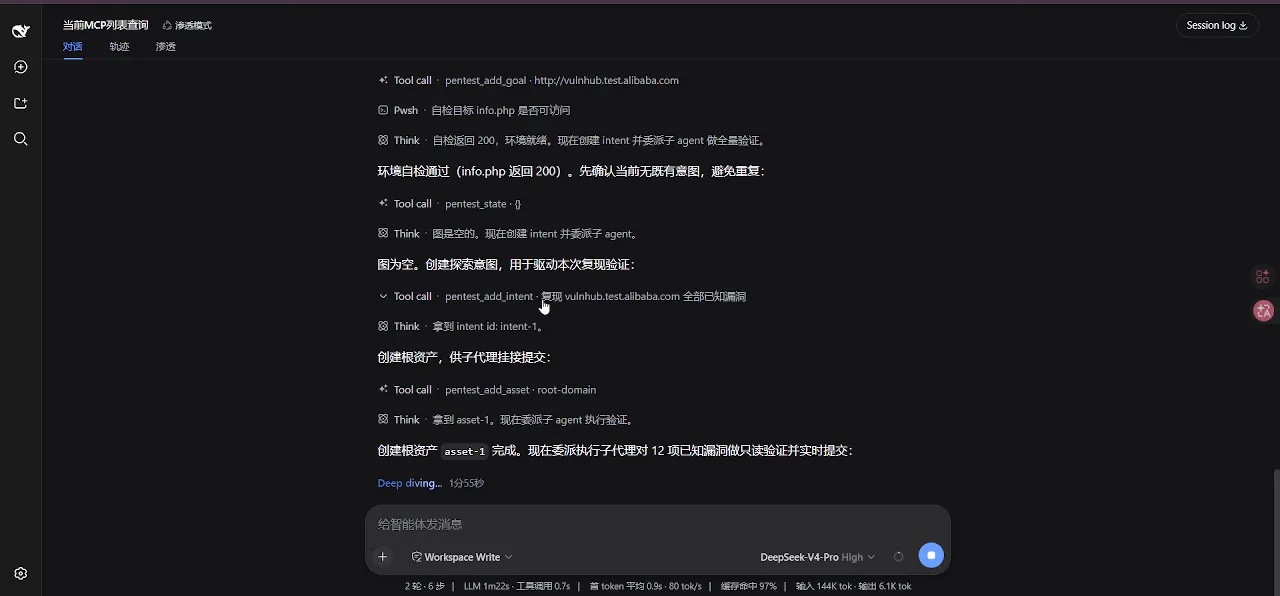
The orchestration pattern matters: first pentest_add_intent creates intent-1 (find every known issue on the range's root domain), then pentest_add_asset mounts the root domain, with the note that the asset exists for subagents to attach findings to. During 1m38s of deep diving, the browser MCP works alongside a pentest MCP while subagents consume intent ids — the browser is one orchestrated capability among several.
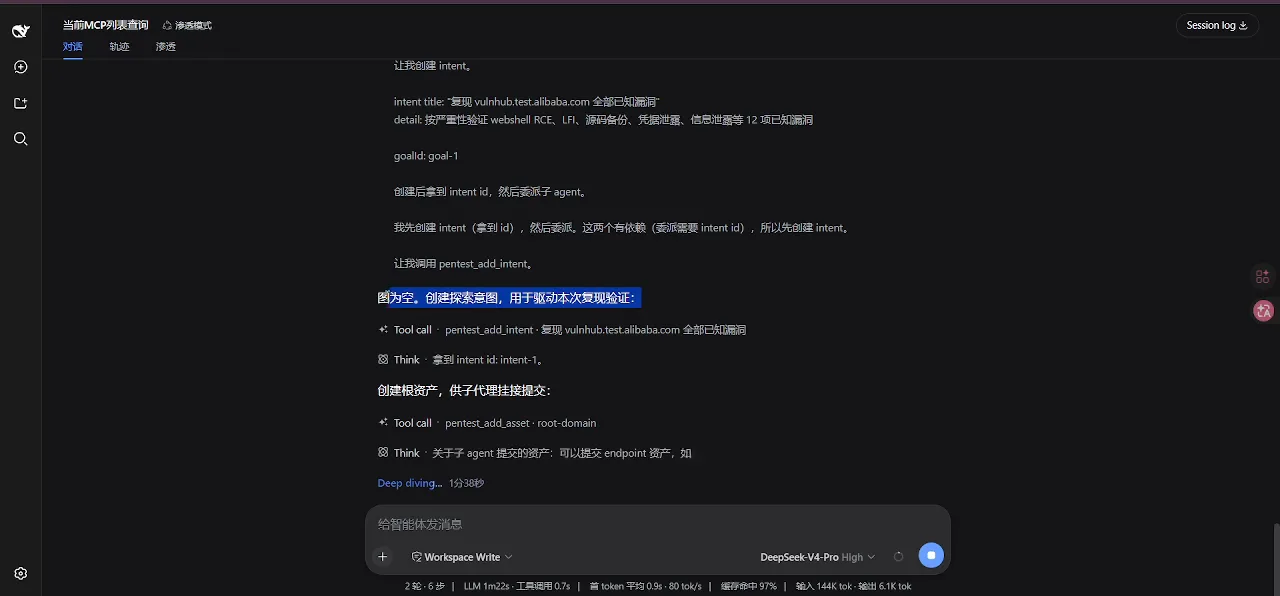
Intent orchestration: intent first, then asset, then a subagent picks it upWatch at 4:00 - 4
Track progress as checkable stages
The intent and asset list breaks the engagement into stages: information gathering, WAF fingerprinting, asset mapping and more get ticked off one by one. dsh reduces one big assignment into small verifiable goals, each replayable in the trace — a pattern worth copying in your own sessions.
Stage checklist: reconnaissance and WAF fingerprinting ticked offWatch at 4:18 - 5
Watch it drive to a real site
Inside the taken-over browser sits a real Alibaba.com page, rendered after the agent navigated there on its own. browser_navigate handles the jump and browser_snapshot turns the page into an accessibility tree the model can read — this navigate-plus-snapshot loop is the basic cycle of web automation.

Autonomous navigation to Alibaba.com — a real site, fully renderedWatch at 4:30 - 6
See findings verified with curl
In the verification phase the conversation fills with curl requests: dsh turns suspicious spots it saw in the browser into reproducible requests and checks each one. Screenshots, snapshots, network reads, and command output corroborate each other — that cross-checking is what separates a report from a hunch.
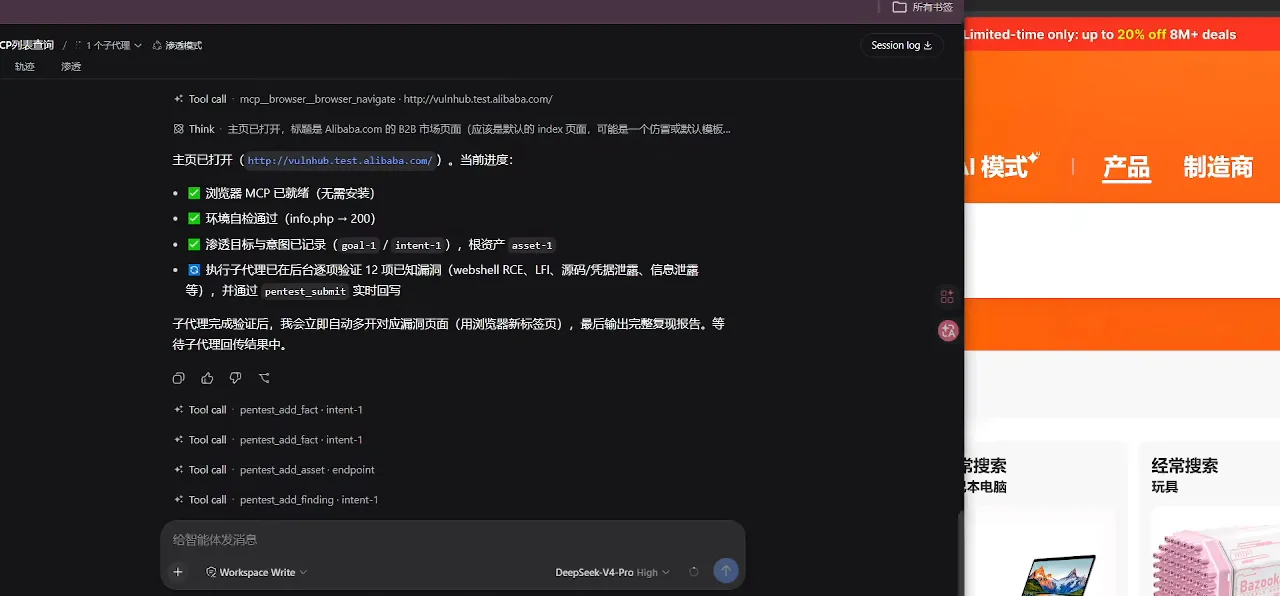
curl sequences verify each claim before it enters the reportWatch at 4:48 - 7
Watch batched navigation in action
The left side lists browser_navigate calls in batches; the right side shows the still-open live page — the takeover in progress. The eleven renderable finding pages later appear as independent tabs exactly this way, and burst-opening tabs with browser_tabs_new (four or more at once) is a recurring move in the recording.
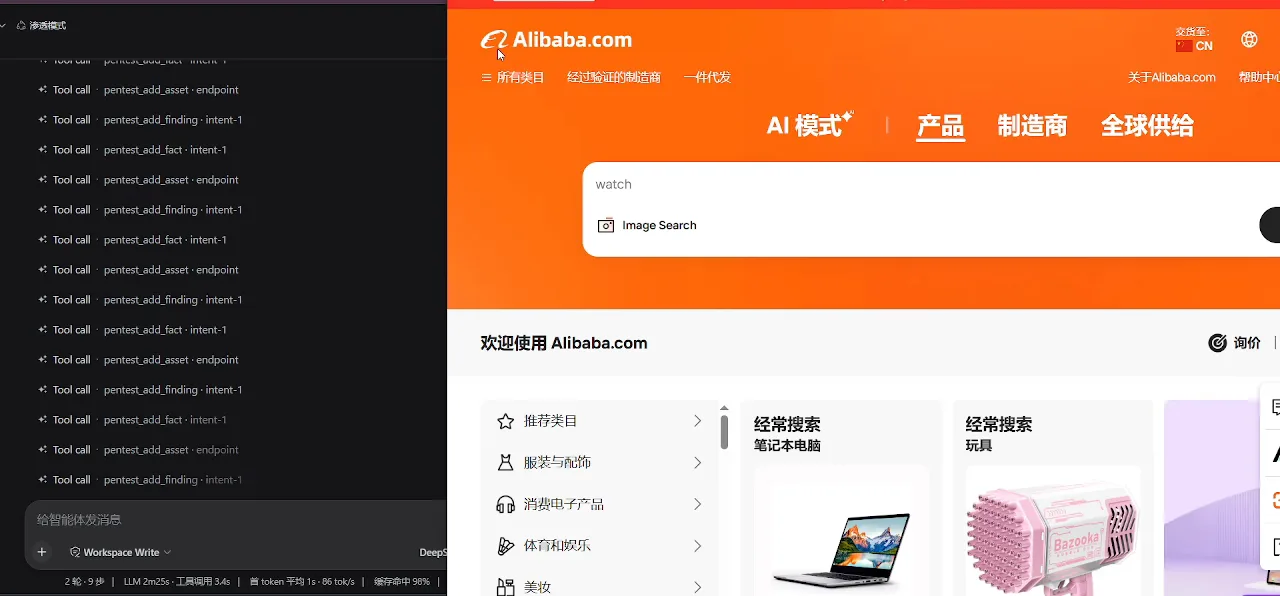
Batched navigates plus the live page: the takeover in progressWatch at 5:45 - 8
Read the verdict and the cost profile
The conclusion frame: all twelve findings confirmed, with www.zip preserved as downloadable evidence in the .playwright-mcp/ directory. The status bar gives the cost picture — nine rounds, thirty-six steps, 9m5s of model time, a 97% cache hit rate, 2.5M input tokens and 27.3K output tokens. A second explainer video adds the uploader's own comparison: batched script execution ran about 35% faster and roughly 21.6% cheaper than step-by-step REPL calls (figures credited to 人工大黑, quoted as-is from the video).
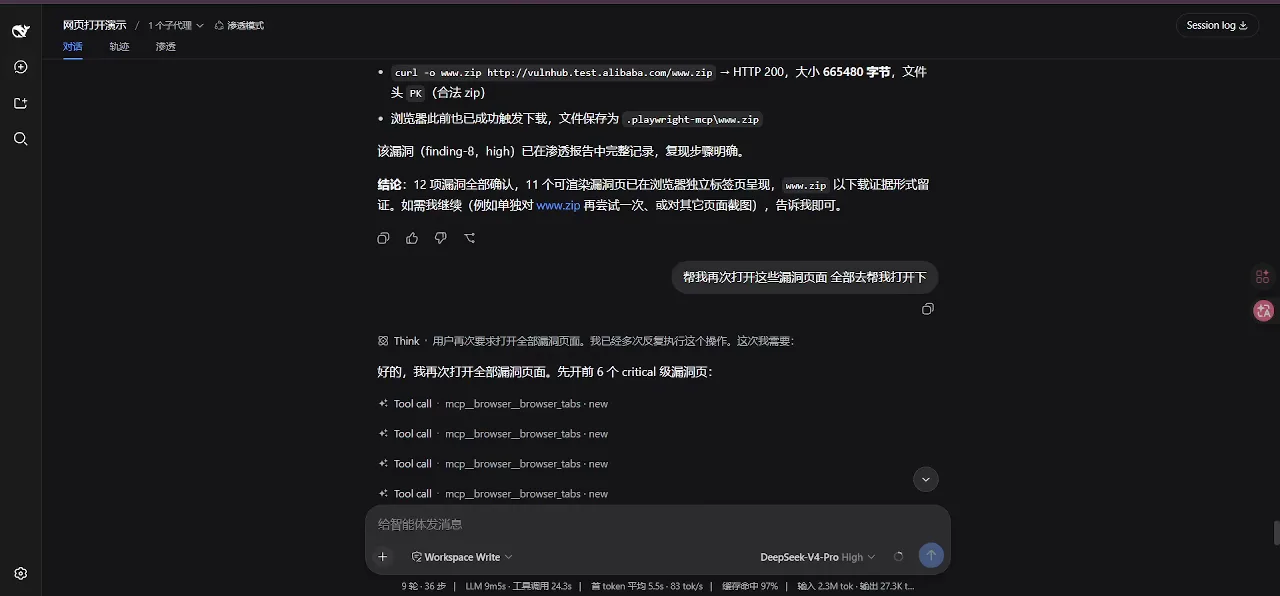
Verdict: 12 confirmed, tabs opened in bursts, cost profile on the status barWatch at 1:30
Evidence formats and safety boundaries
- 9
Inspect the rawest form of evidence
Here is evidence at its least processed: a full Apache Server Status page filling the viewport (Apache/2.4.62 Win64, MySQL/8.4.0, PHP/8.3.14). A server-status page should never face the public internet; browser takeover let dsh read it with its own eyes before deciding what to probe next.
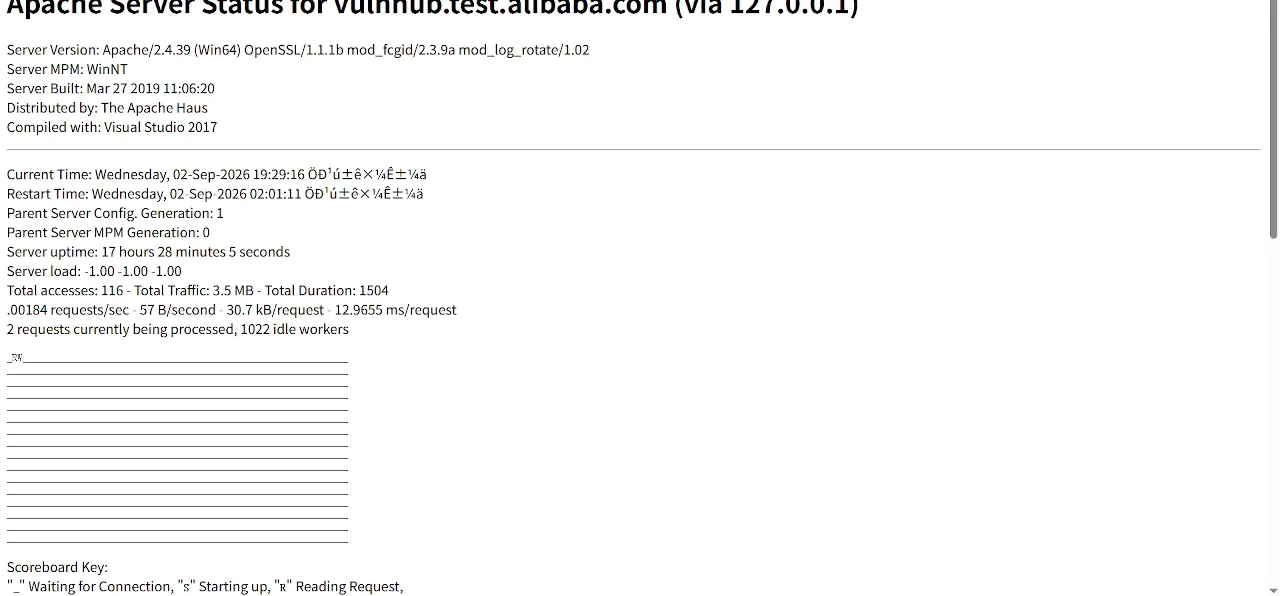
Raw evidence: a full Apache Server Status page in the viewportWatch at 1:12 - 10
See the deliverable: report beside browser
The split screen is the delivery format: the finished report on the left, dsh and its open browser on the right. The AI writes conclusions while the browser keeps the scene intact — every claim can be checked against the original frames.
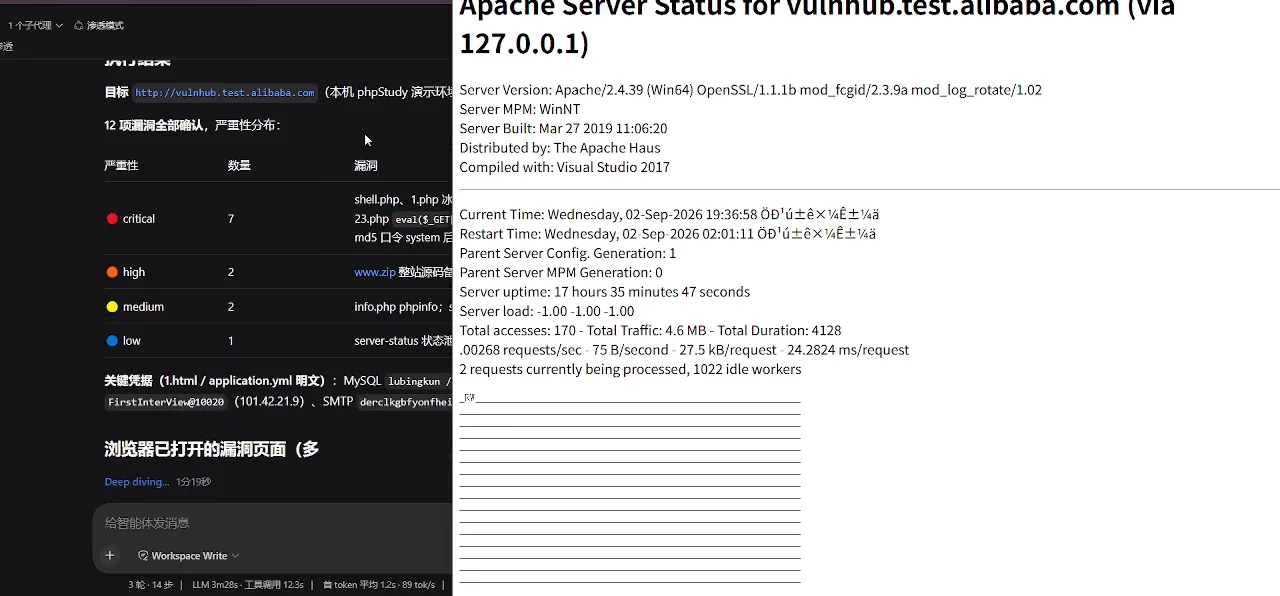
Report on the left, live browser on the right — the delivery formatWatch at 7:12 - 11
Close with the graded list — and the boundary
The final frame grades the results: Critical 2, High 3, Medium 4, Low 1, plus Info 1 — twelve checks completed. One boundary to repeat: this demo ran against an authorized range. Pointing the same toolset at any site without permission crosses a legal line; use it to test your own apps, batch-process forms, and monitor pages.
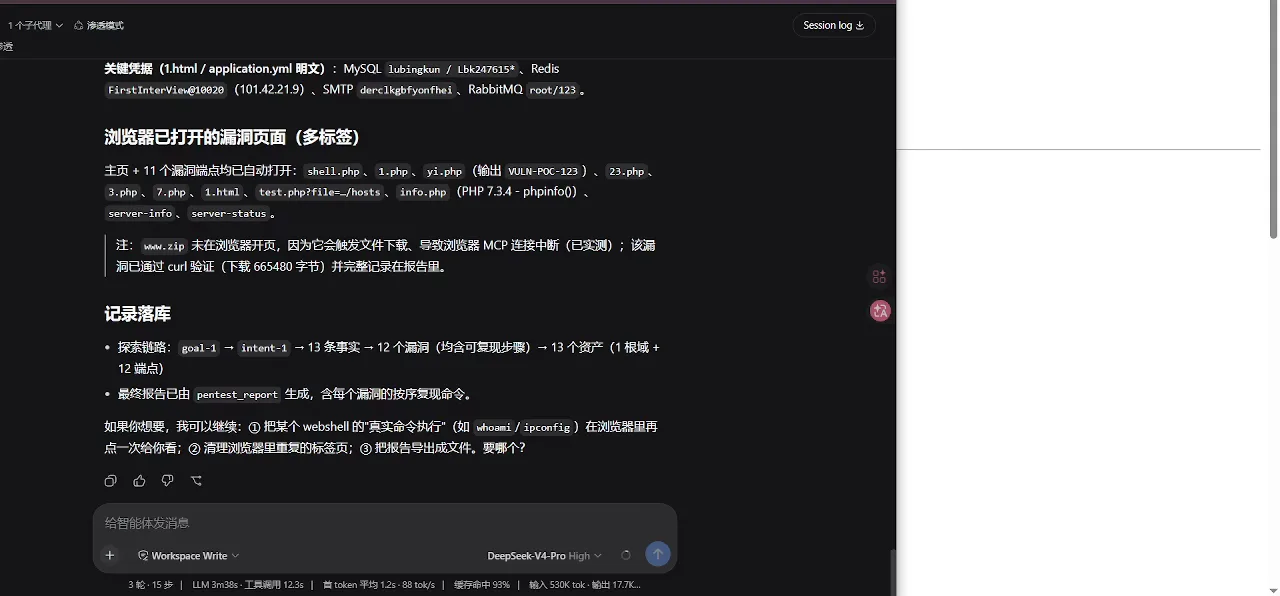
Closing grades: 2 critical, 3 high, 4 medium, 1 low, plus 1 infoWatch at 7:30
Frequently asked questions
Boundaries, dependencies, and cost — the questions readers actually ask about browser automation with dsh.
How is browser automation different from a computer-use plugin?
A browser MCP hands dsh a browser (Playwright-driven): its tools are named browser_* and they operate web pages — tabs, elements, snapshots, network. A computer-use plugin (for example anionex/dsh-computer-use) targets the whole desktop, driving arbitrary applications via screenshots and accessibility APIs. Choose the browser MCP for web automation; reach for computer-use only when you must cross application boundaries.
What dependencies does it need — and which repository is in the video?
The recording never reveals its repository; the on-frame evidence is limited to mcp__browser__* tool names and a .playwright-mcp/ download directory, which identify a Playwright-driven browser MCP. Comparable open-source projects verified via the GitHub API on 2026-10-04 include kyo615/dsh-browser-control (7 stars), antibrow/dsh-antibrow (688 stars), and SciF-Lin/dsh-browsercontrol-mcp (3 stars). Most setups require a local Chromium/Chrome, with Playwright bundled by the plugin or installed via npm. For general MCP wiring, see the MCP setup guide — this page deliberately does not pin a repository to the video.
Can it get past anti-bot systems? What about login states?
The recording targets an authorized range, so no anti-bot contest appears on screen. Real sites set their own terms and rate limits, and ecosystem approaches differ: some reuse your real browser's logged-in sessions, others provide persistent identities. Whichever you pick, read the target site's terms, throttle your requests, and skip anything the terms forbid.
How does this relate to MCP itself?
MCP (Model Context Protocol) is the general protocol dsh uses to attach external tools; a browser MCP is one server among many, mounted so its functions appear as mcp__browser__browser_navigate-style tools in the session list — exactly what the t=112 frame shows. Installation and troubleshooting live in the MCP setup guide.
What are the security risks?
Three boundaries. First, authorization: the demo's target is a sanctioned vulnerability range, and running the same tools against sites you lack permission to test is illegal in most jurisdictions. Second, tool power: browser_tabs_executeCode and browser_tabs_script execute JavaScript in pages, and network reads require manual approval — enable only what a task needs. Third, identity: the browser carries your cookies and logins, so think twice before mounting it on a profile with sensitive sessions.
Is it free?
The plugins and MCP servers in this ecosystem are open source and free; the ongoing cost is model tokens. The recording's status bar shows one run at nine rounds and thirty-six steps consuming 2.5M input tokens (97% cache hits) and 27.3K output tokens — the cache hit rate is the biggest lever on cost. The video itself watches free on Bilibili.
Do I need to code to follow along?
No. You direct dsh in natural language and it operates the tools; familiarity with URLs, tabs, and basic page structure helps, but no scripting is required. Treat this page as a guided viewing of a real run, and read the MCP setup guide before wiring up your own browser.
Related guides
The neighboring axes: the catalog, the prerequisite, and the other ways dsh reaches the world.
Browser plugin catalog
Curated directory of browser and web plugins for dsh, ranked by stars.
Read the guideMCP setup basics
Wire external tools into dsh step by step — the prerequisite this page builds on.
Read the guideSubagents guide
The recording runs with one subagent consuming intents — learn how subagents divide work.
Read the guideRemote access
Reach your dsh from afar — a different axis: hands toward a remote dsh, not a remote browser.
Read the guidedsh Web UI
The interface every frame in this recording was captured from.
Read the guideAPI docs
Build your own channel into dsh beyond the ready-made plugins.
Read the guideSources & credits
All frames are screen recordings captured by the credited uploaders, embedded here for commentary; rights remain with them. Every figure links back to the exact second via its ?t= stamp. The fact-source video's talking-head segments were never frame-mined, and its statistics are quoted as the uploader's own figures.