
README
dsh-usage-panel
Token usage statistics for DeepSeek Harness, shown as a page under Settings → Usage in the web GUI. The plugin aggregates persisted session logs (incrementally, via the session-projection mechanism) and never writes anything back.
简体中文 · 





What it shows
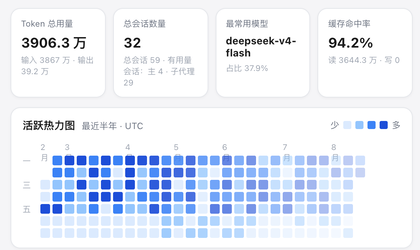
- Cumulative totals (all time) — billed input / output tokens, main-session count (
delegationDepth === 0, matching the visible session list exactly: zero-usage sessions count, archived ones do not; with the grand total of session records and the main/subagent usage split beneath it), and the most-used model with its share. - Cache hit rate —
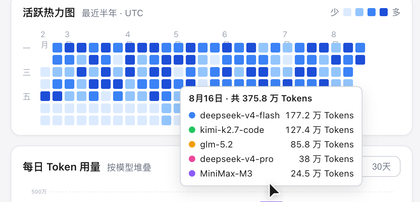
cache read ÷ (uncached input + cache read + cache write), with the read/write magnitudes. - Activity heatmap — the last six months in a GitHub-contribution layout (weeks as columns, weekdays as rows). Days are colored by quartile over non-zero usage.
- Daily stacked bars — per-model token usage, switchable between the last 7, 14, or 30 days.
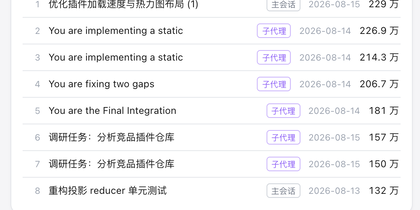
- Top sessions — the 10 most token-hungry sessions with their folded titles, each tagged main or subagent by delegation depth.
- Providers — per-provider token totals as horizontal bars (shown when more than one provider route is in use).
- Model donut — all-time share per model, with the top 5 listed beside it; each row carries a per-model cache hit rate column, color-coded to its segment.
- Export — full JSON, daily CSV and per-model CSV (formula-injection guarded, RFC 4180, UTF-8 BOM).
Hovering a bar, heatmap cell, or donut segment shows the exact breakdown:
| Bar tooltip | Overview (KPI + heatmap) | Sessions & providers |
|---|---|---|
 |
 |
 |
Install
The plugin ships as a bundle: dsh plugin add appends it to the profile's bundle list, and the patch row activates the host half.
# from npm (recommended)
dsh plugin --profile web add dsh-usage-panel

# or from GitHub
dsh plugin --profile web add github:AlfredChaos/dsh-usage-panel

# or from a local checkout
dsh plugin --profile web add ./dsh-usage-panel
Restart dsh --profile web and open Settings → Usage. The npm package ships prebuilt JavaScript under lib/ with no install scripts; GitHub installs need no pnpm build allowance either, because the same files are committed to the repository. To remove it:
dsh plugin --profile web remove dsh-usage-panel
Where the numbers come from
The host half aggregates persisted session logs:
- Primary path (incremental): a session projection (registered through
ctx.sessionProjections,stateVersion-checked) folds every committed event into four disjoint buckets — uncached input, output, cache read, cache write — plus per-model, per-provider and per-day (UTC) maps. Checkpoints are durable, so restarts and keep-warm passes cost almost no replay. - Fallback path (full rescan): when the projection services are unavailable, the same reducer replays every session log through the read-only
sessionQueryservice.
Accounting rules: request/header and request/context events record the model (context base, header override); the step's assistant/message usage replaces streamed provisional usage (a retried same-step message never double-counts); llm/retry events are counted as retries, not tokens; compaction/summary usage is attributed to its own model and reported separately; reasoning tokens are already inside output and are never added again.
Fork dedup: events inside the durable seed prefix (inheritedEventCount) are never counted, so forked sessions do not double-bill their parents' usage. session/end-seed markers only delimit resume/fork accounting epochs — resumed sessions keep every window of their own usage.
Timezone declaration: day buckets and exports use UTC calendar days (YYYY-MM-DD); the heatmap subtitle declares the scope ("last 6 months · UTC").
Because nothing is written back, statistics survive restarts and cover sessions from before the plugin was installed.
Loading behavior
The first scan starts as soon as the plugin loads, so the page usually renders straight from cache. A payload is considered fresh for 10 minutes; older ones are returned immediately with a stale flag (the page shows "updating in background") while a rescan refreshes the cache. A keep-warm timer rescans every 10 minutes, and the refresh button always forces a synchronous scan. The browser additionally keeps the last successful payload in localStorage (versioned and structure-validated), so a page refresh renders instantly; a failed refresh keeps the cached numbers and says so instead of faking freshness.
Units
zh interface: 亿 (10⁸) and 万 (10⁴); en interface: K / M / B.
Implementation
Source is TypeScript (strict) in src/, built with esbuild; the lib/ outputs are committed so installs need no build step.
| File | Role |
|---|---|
src/host/index.ts → lib/index.js |
Host half (Cordis plugin): projection registration, aggregation, cached RPC with warm-up, fail-soft fallback |
src/host/projection.ts |
Pure per-session projection reducer (four buckets, fork dedup, retry/compaction semantics, UTC days) |
src/host/aggregate.ts |
Cross-session merge → overview payload |
src/client/* → lib/client.js |
Client half (./client export, __ModuleLoader__ bundle): settings-page UI in TSX, --dsw-* tokens, zh/en i18n |
src/shared/contract.ts |
Host↔client wire contract (single source of truth) |
cordis.patch.yml |
Bundle patch: inserts the usage-stats row into the profile composition |
The host serves an overview endpoint as an exact-path route on the shared /api transport (ctx.connection.fetch.register('/api/usage-stats/overview', …) — the connection plugin's route applies the Host/Origin fence and browser auth); the browser calls it via rpc.call('/api', 'usage-stats/overview', …). The overview carries coverage (session-record totals and the main/subagent usage split, shown beneath the sessions KPI), topSessions, providers, plus the v0.1.0-shaped days / totals / byModel / allTime. Developed against DeepSeek Harness 0.1.5-rc.1. Tests run on the Node built-in test runner (npm test); CI runs typecheck + build + test + the pack gate.
License
更多「用量与计费」插件
dsh-cost-meter
作者 han-1413141
DeepSeek Harness 会话与当日 API 费用、预算与官方余额统计插件:历史看板、峰谷计价与官方价格一键同步。
dsh-usage-stats
作者 ychris12138
为 DeepSeek Harness Web GUI 提供提供方余额、订阅额度与 Token 用量分析。
tokdash
作者 jingbiaomei
智能体仪表盘:以热力图、成本追踪与 Token 计数可视化各提供方的会话与配额用量,帮助分析与优化。
dsh-balance-meter
作者 ghost011118
在 DSH Web 输入框下方实时显示 DeepSeek 账户余额与本场会话花费,自动抓取官方价格并支持峰谷计价。