
DeepSeek Harness Session Replay: Read the Trajectory Receipt
How to reopen past sessions, read the execution trace, drill into any tool call, branch a retry, and export the log — step by step.
Last updated: 2026-09-15
DeepSeek Harness never throws a run away. Every session is kept, and every session writes an append-only trajectory log — a receipt of everything the model saw and did. Close the app, come back tomorrow, and your full history is still there, ready to replay.
This guide walks the whole replay workflow: where the history lives, how to reopen a past session, how to read the Trajectory tab row by row, how to drill into a single tool call, how to branch a new attempt off the same task, and how to export the log for offline analysis.
Replay a DeepSeek Harness session, step by step
- 1
Know that every session is kept
Sessions in DSH are persistent: even if you close the harness and reopen it the next day, all of your previous work is still listed in the left sidebar. Sessions are grouped under their workspace, with relative timestamps like 2d or 10min. Persistence is built in — there is nothing to switch on.
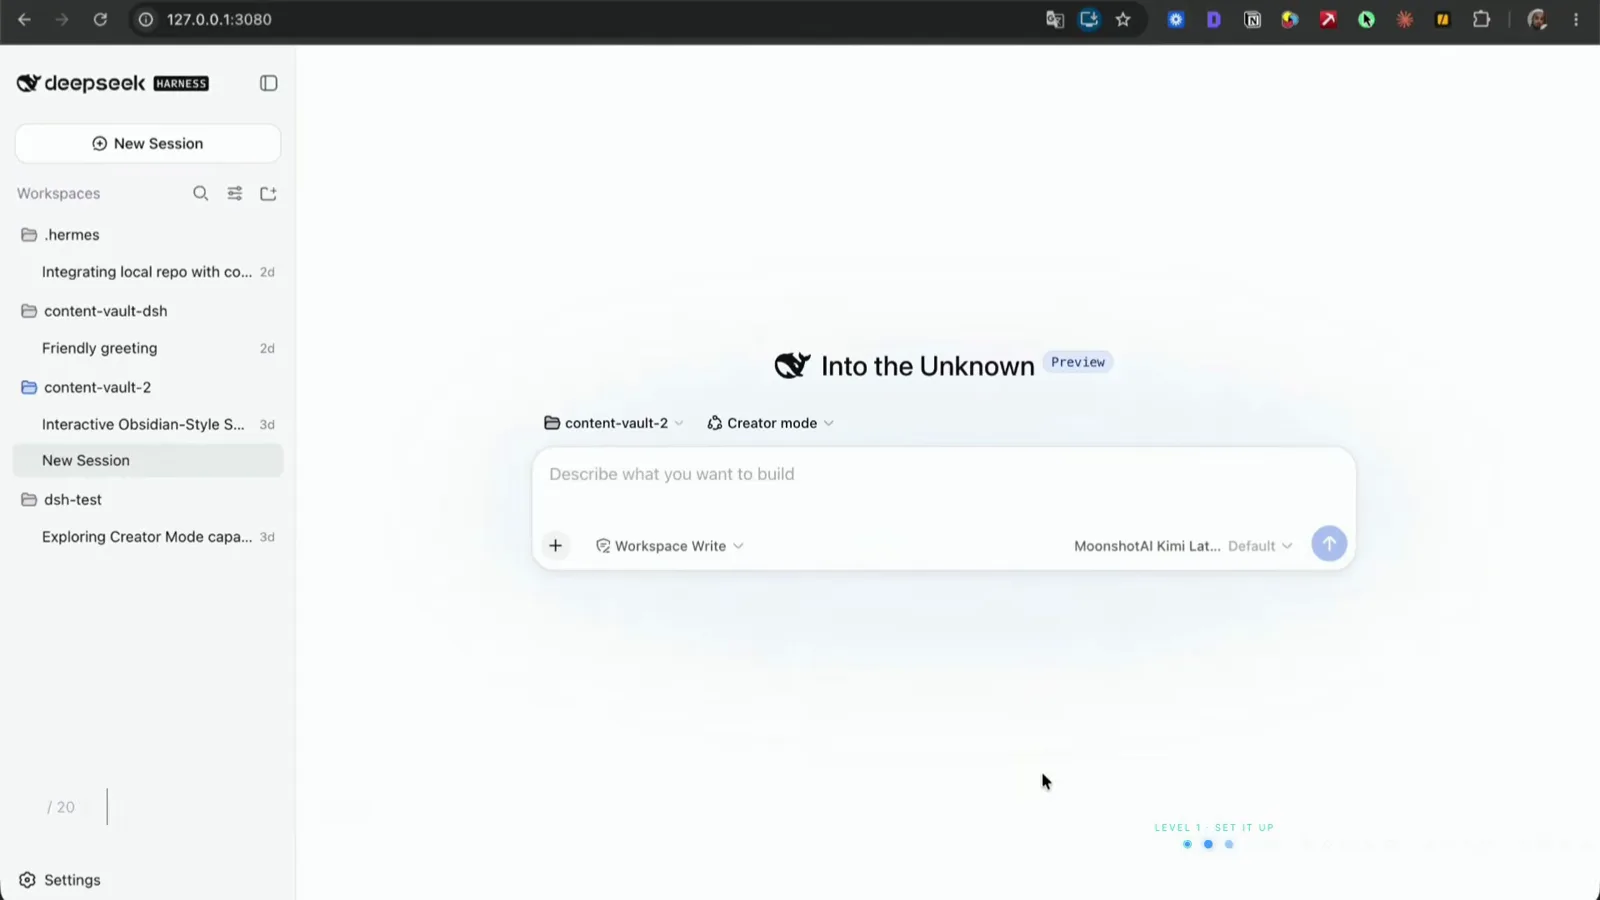
History needs no setup — sessions pile up under their workspace with ages like 2d or 10min.Watch at 1:46 - 2
Reopen a past session from the sidebar
Click any session in the sidebar to reopen its full chat transcript. You can scroll the entire conversation, re-read every answer — including approval prompts and the options the agent offered — and keep asking questions in the same thread, right where you left off.
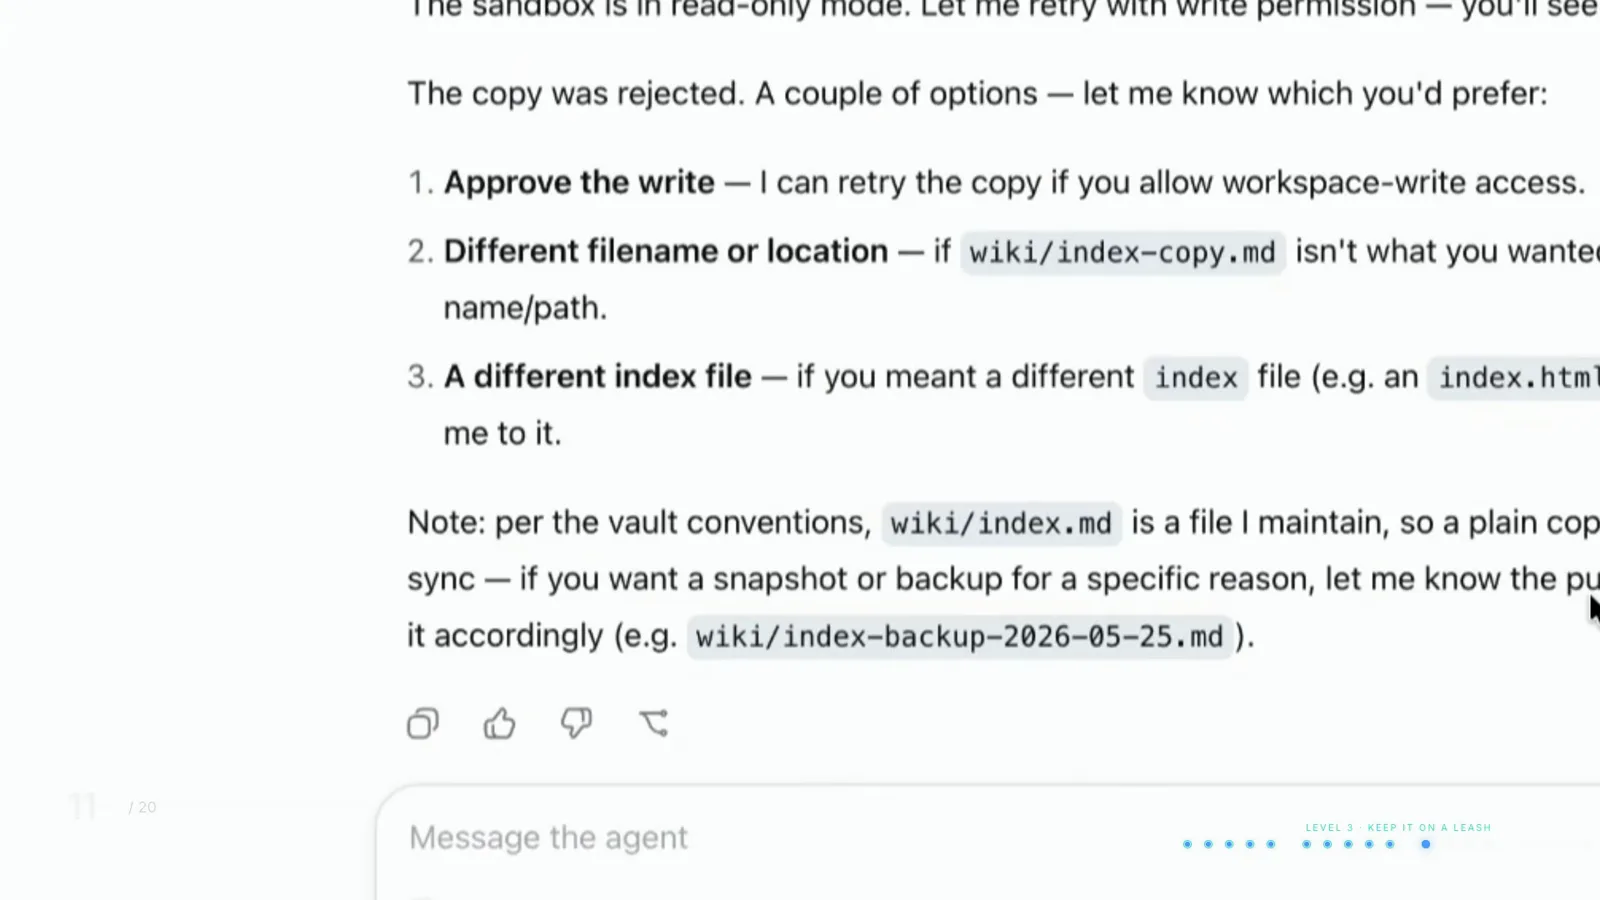
Reopened sessions scroll back to every answer, approval and option — the whole thread, intact.Watch at 8:25 - 3
Switch to the Trajectory tab
Each session header has two tabs: Chat and Trajectory. Trajectory is the session's receipt. It opens on a Duration, Turns and Calls summary, a timeline ruler stacking Input, Model and Tools activity, and a status bar — the session below ran 7 turns and 38 steps, spent 21m26s in the LLM at 49 tok/s with a 93% cache-hit rate.
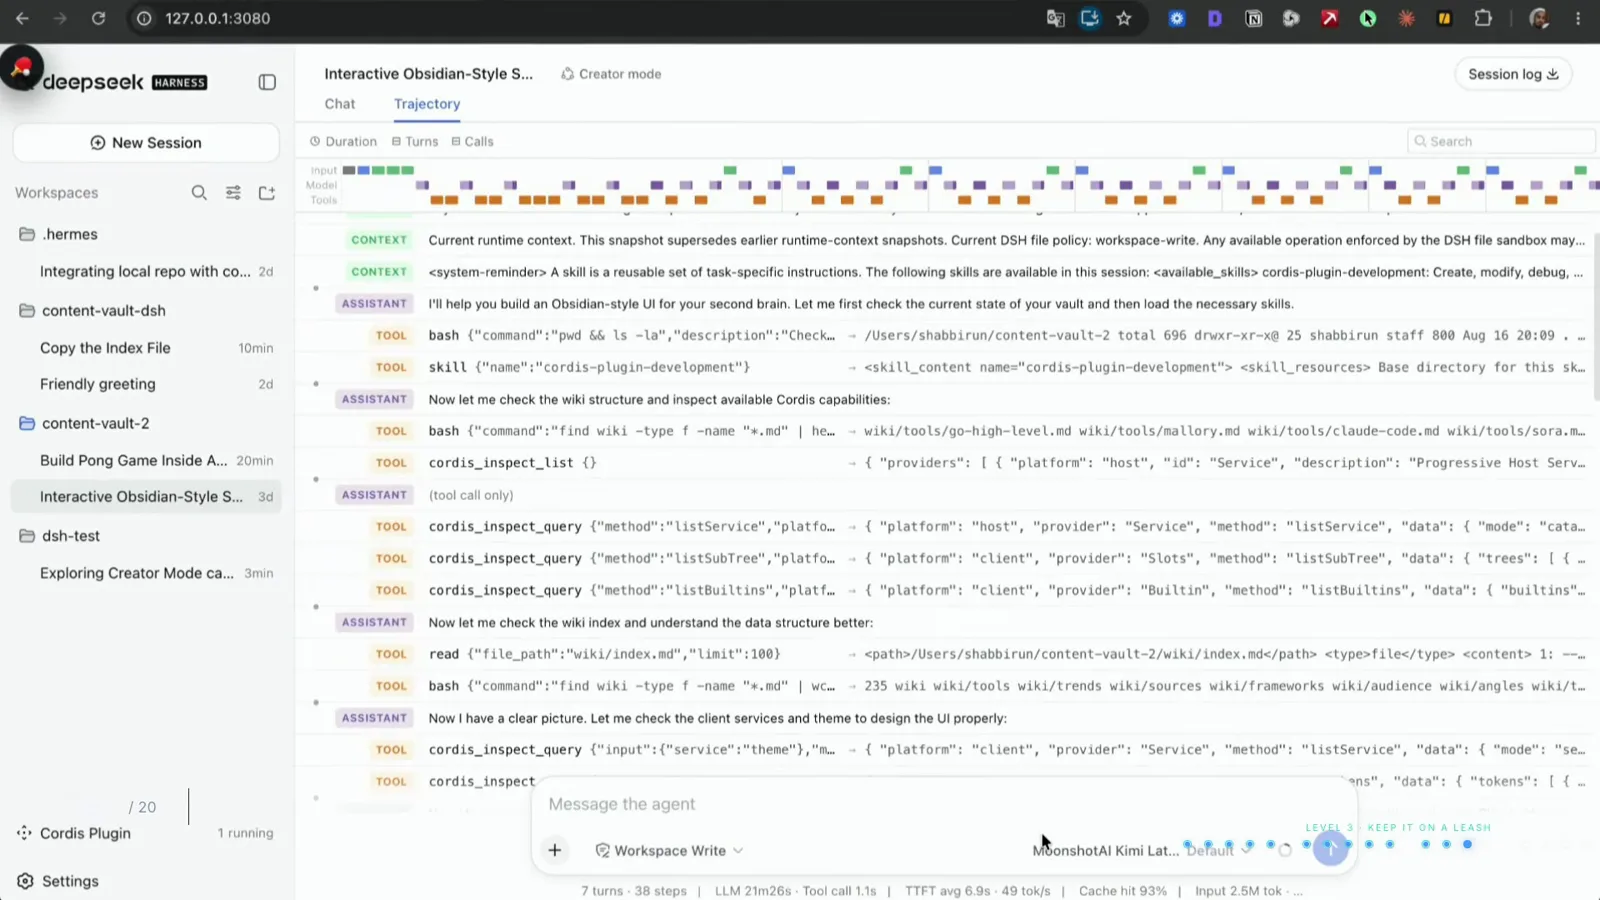
One tab gives you the whole run: counters, timeline ruler, status bar — and every row below is the receipt.Watch at 9:27 - 4
Read the receipt row by row
The log is append-only: entries are added, never edited or overwritten. Rows are labeled by role — SYSTEM for the initial system prompt, CONTEXT for snapshots and reminders slipped in at runtime, USER for your prompts (and errors), ASSISTANT for reasoning, TOOL for every call and its result. Different types are color-coded, and clicking the first row opens the full default system prompt in a side panel.
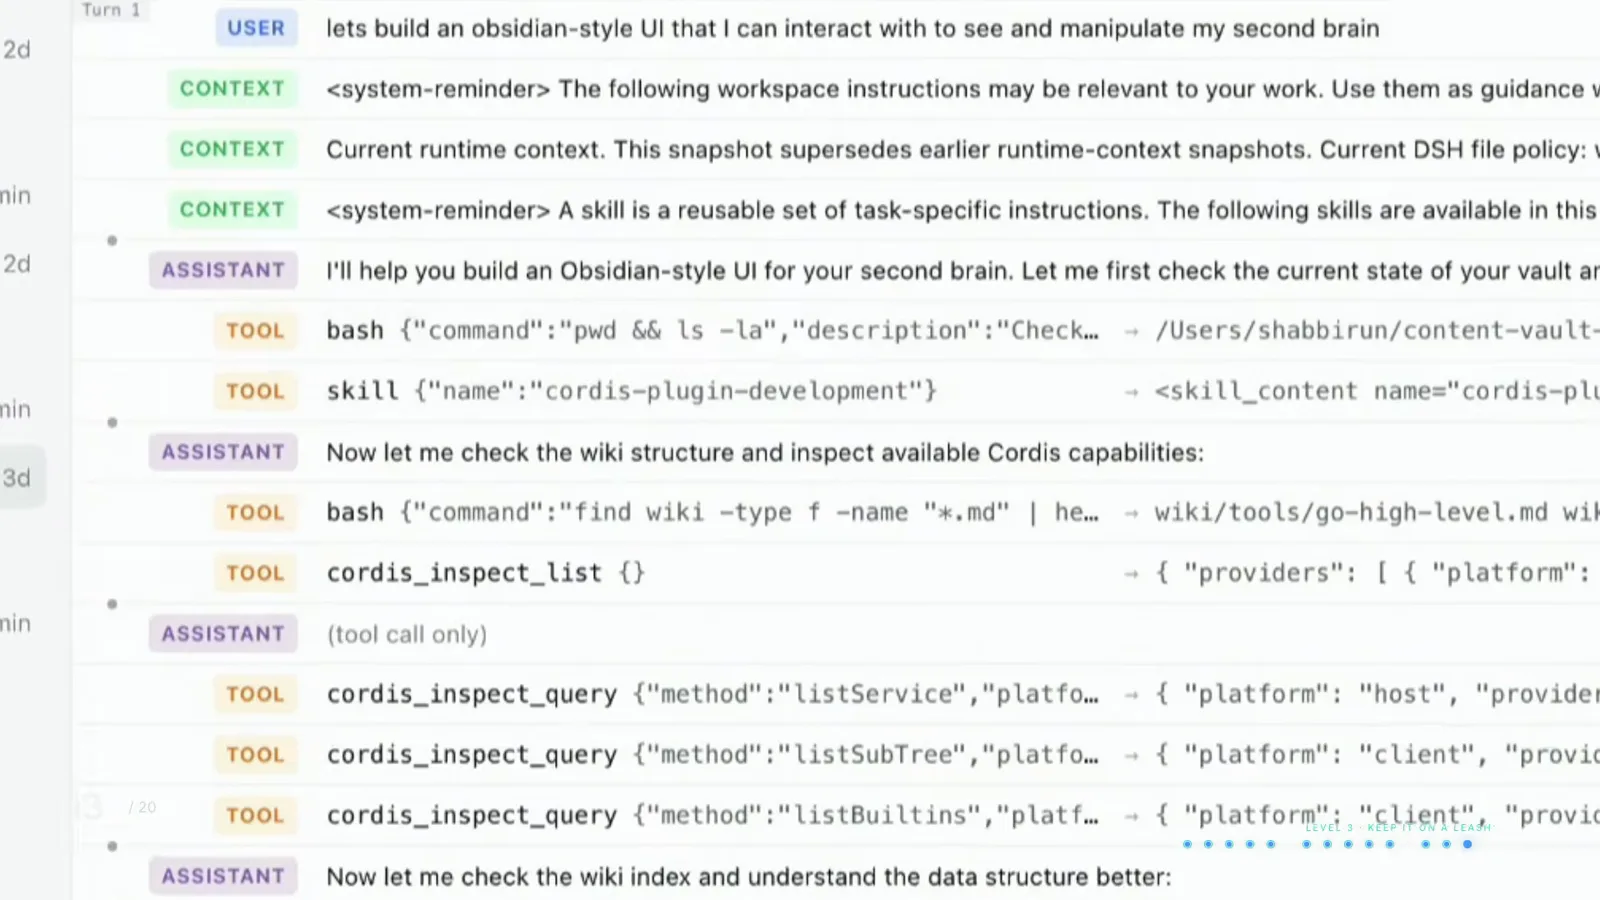
SYSTEM, CONTEXT, USER, ASSISTANT, TOOL — every call shown with its payload and its result, append-only.Watch at 9:38 - 5
Drill into any tool call
Every TOOL row expands: click one to see the summary, the payload it sent, the raw result that came back, and the execution time. In the frame, the bash call's full output — the directory listing it based its next decision on — is on screen, so nothing about the run has to be guessed.
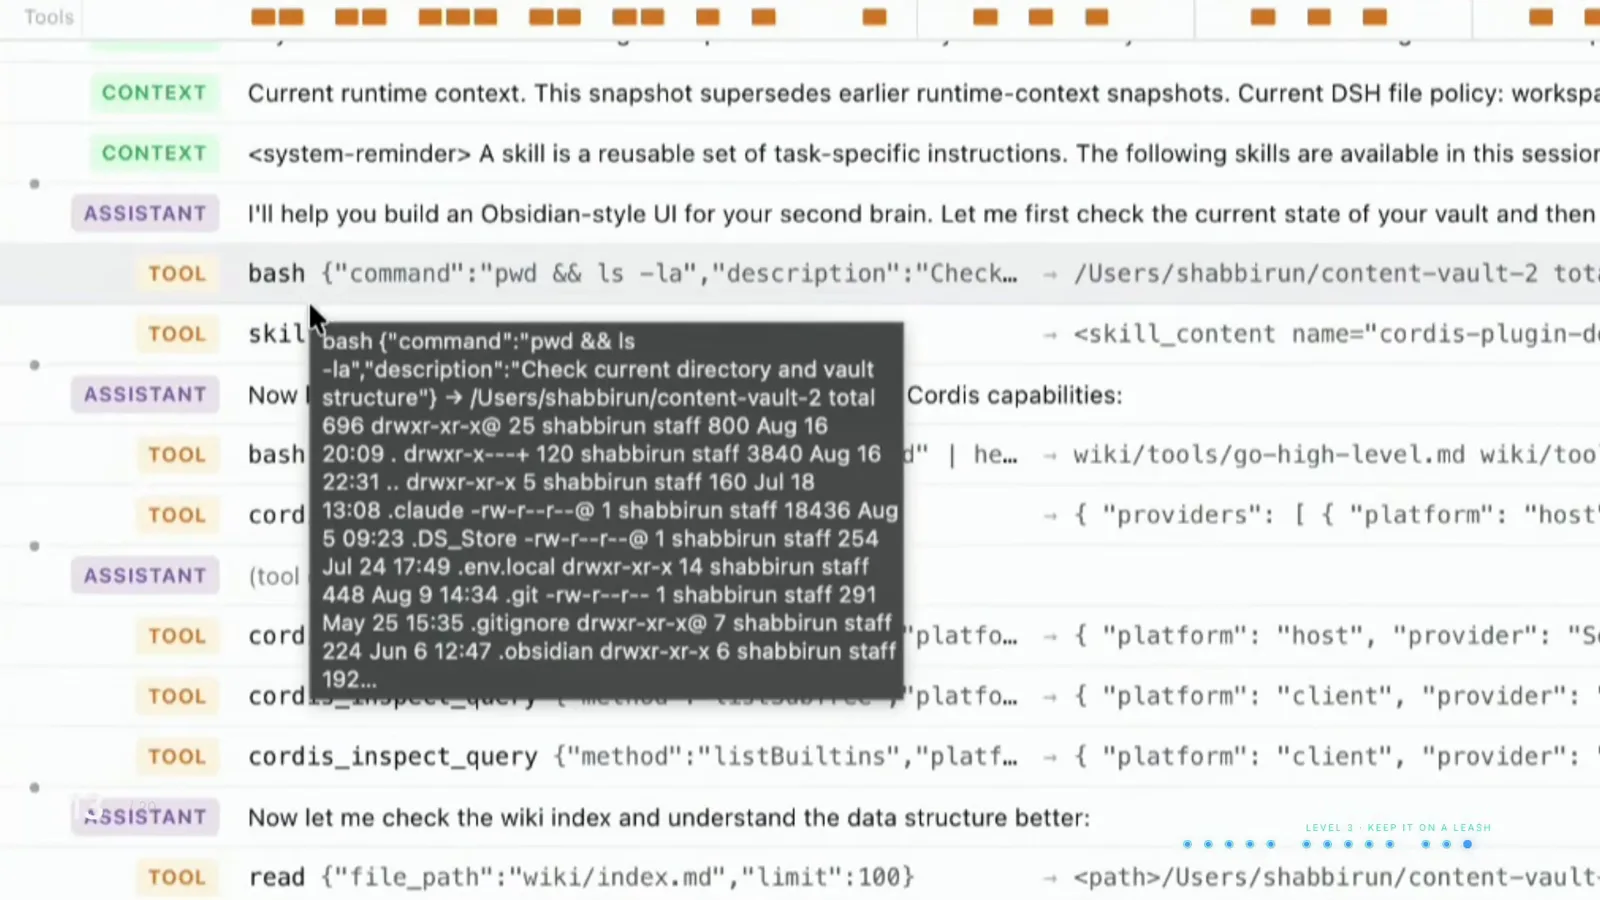
Open one TOOL row and the raw result is right there — this bash call's complete directory listing.Watch at 9:35 - 6
Follow the turns to find where it went wrong
Rows group into numbered turns, so you can trace a failure to the exact exchange that caused it. A USER row can even carry an error back to the agent. When a run goes sideways, the receipt shows exactly what the model was told — which is what makes a postmortem possible at all.
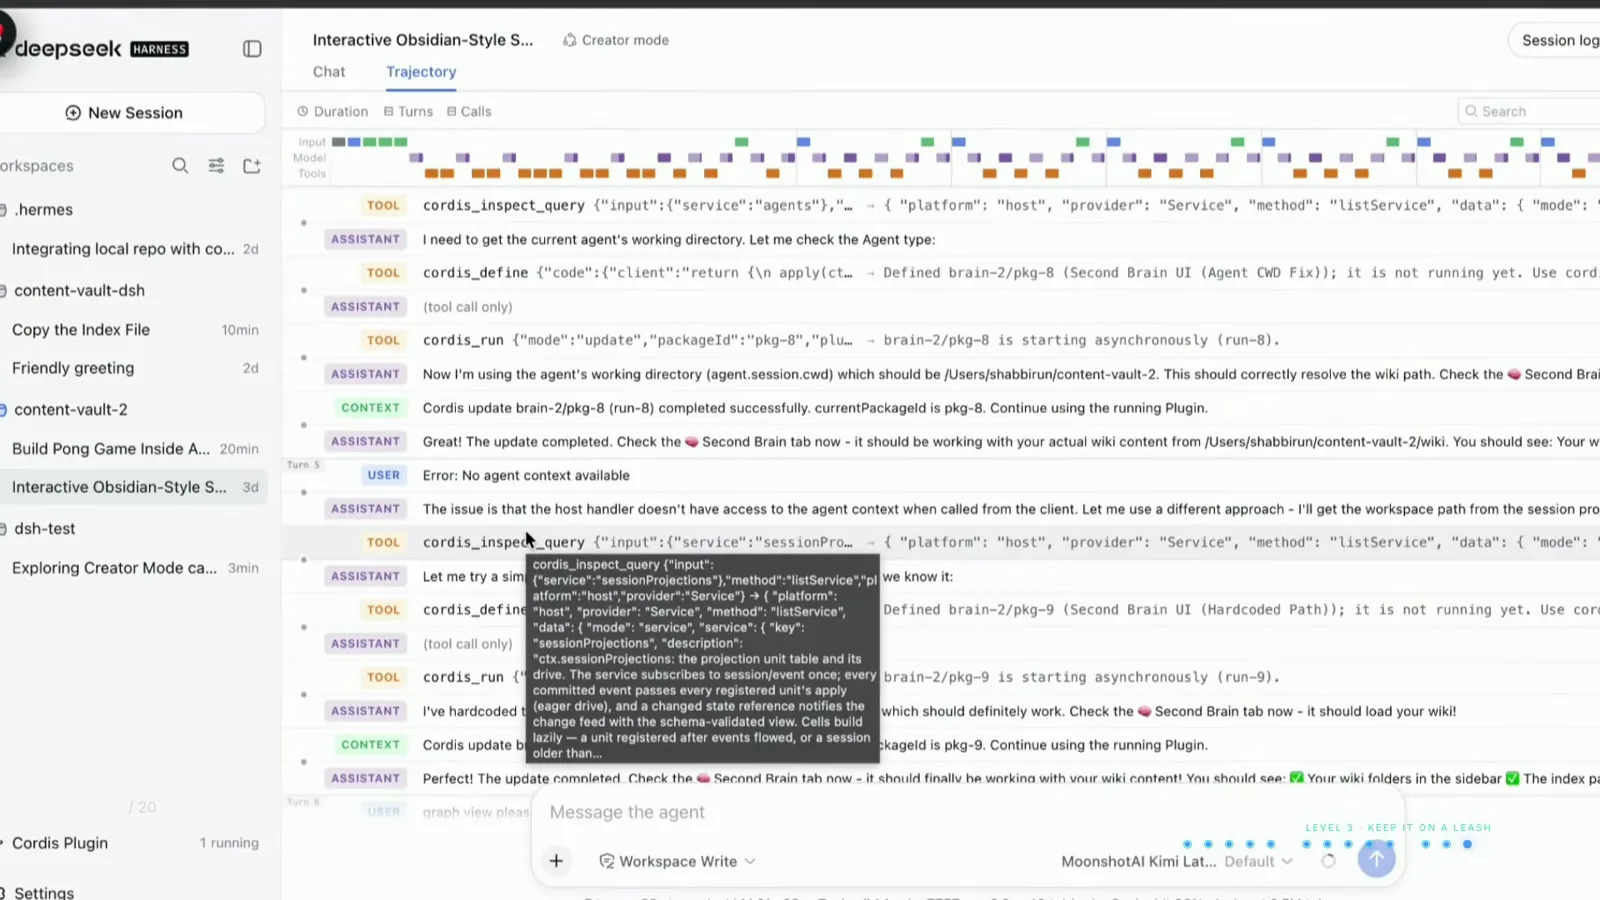
Turn markers make failures traceable — this USER row hands the error straight back to the agent.Watch at 9:50 - 7
Branch a retry off the same task
You don't have to restart from scratch to try a different approach. From a session's chat, click the branch icon to continue that task in a new session — the original keeps working untouched, so you can pursue two solutions to the same problem in parallel: ask one branch to search for an existing fix while the other writes one from scratch.
- 8
Audit the tool surface, then export the log
Scrolled out, the trajectory doubles as an audit of the whole tool surface — every capability the harness actually used in one list; if it's not in the tool list, it can't happen. To take it offline, hit the Session log button in the session header to download the log, or use the session-export command in the slash menu.
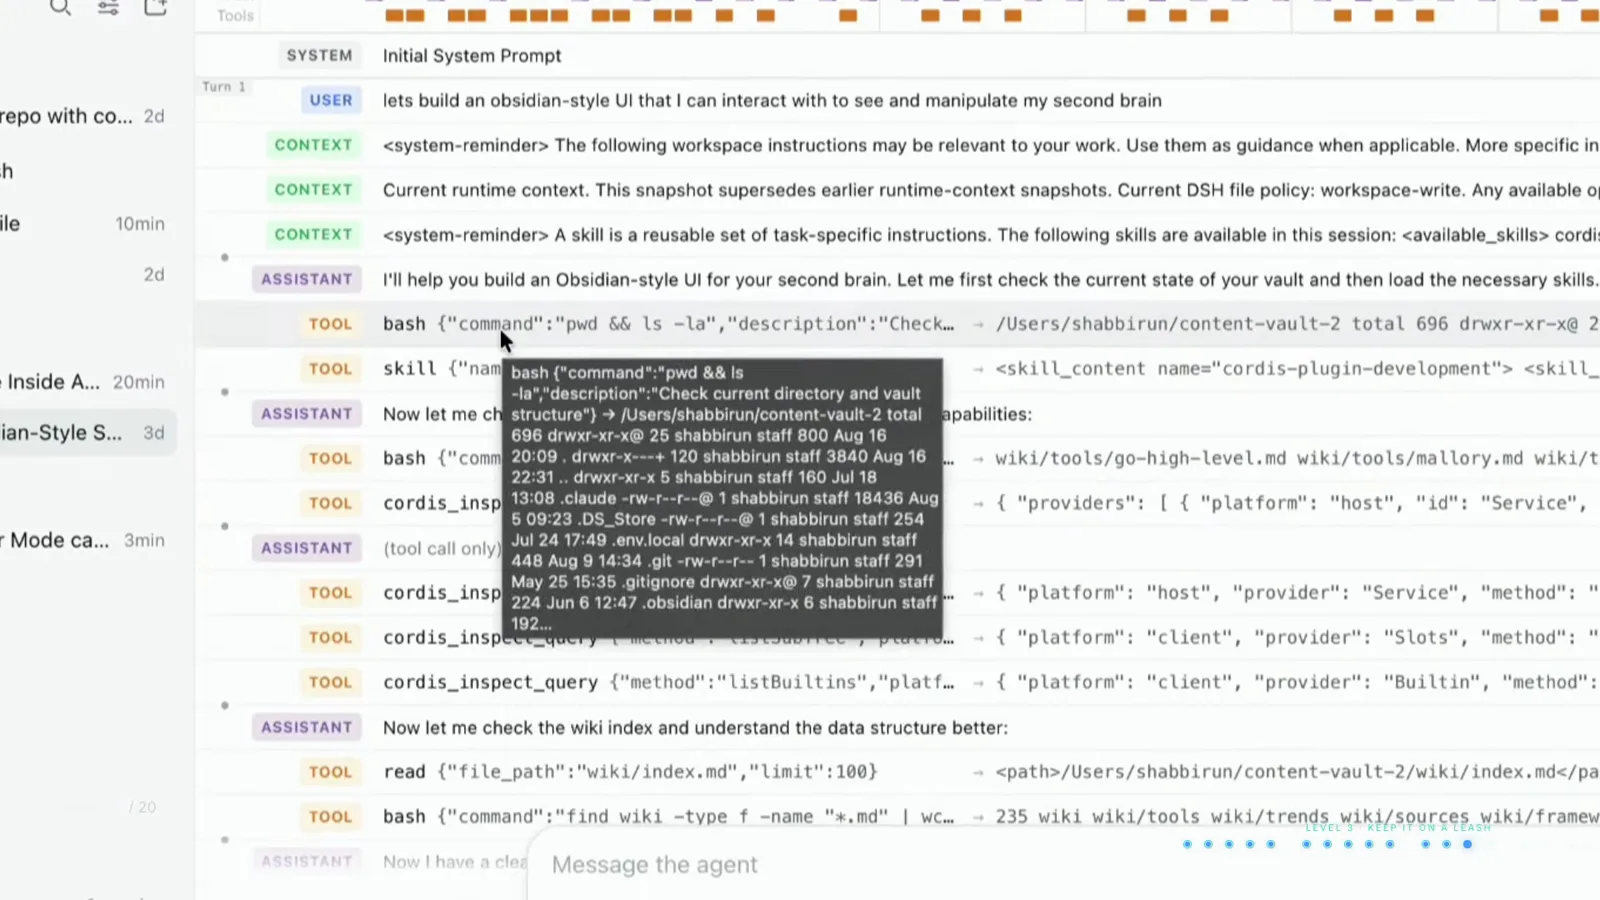
One earlier session's list doubles as the tool surface — bash, skill, read, cordis_inspect, all in the order used.Watch at 9:41
DeepSeek Harness session replay: FAQ
The questions people ask about history, receipts, branching and export.
Where is my DSH session history, and how do I export it?
Every session writes an append-only trajectory log that the Trajectory tab reads back. To export, click the Session log button in the session header — it downloads the log file — or run the session-export command from the slash menu. Replay plugins below add one-click HTML export if you want shareable files.
If I close the browser, do I lose my sessions?
No. Sessions are persistent by default: close DeepSeek Harness, reopen it the next day, and every past session is still in the sidebar under its workspace, ready to reopen and continue where you left off.
What do the SYSTEM, CONTEXT, USER, ASSISTANT and TOOL labels mean?
They are the roles of the receipt. SYSTEM is the initial system prompt, CONTEXT is what got injected at runtime (file policies, skill reminders, snapshots), USER is your prompt, ASSISTANT is the model's reasoning, and TOOL is each call with its payload and result. Rows are color-coded and append-only.
Can I re-run a task from a middle step instead of starting over?
Yes — that's the branch feature. Click the branch icon on a message to continue that task in a new session while the original keeps running. Both branches execute independently, so you can try two different solutions to the same problem side by side.
Are there plugins that improve replay and sharing?
Yes — the plugin directory lists several replay enhancers: dsh-replay (replay, audit, compare and export sessions in the web UI), dsh-agent-replay (replays trajectories as standalone interactive HTML), and dsh-session-lens (session insights with a shareable HTML replay).
How is this different from the token-usage view?
The trajectory answers what happened and why — steps, tool calls, results and timings. The usage view answers what it cost — tokens, latency and throughput per request. Read our token-tracking guide to turn the same trajectory numbers into a cost picture.
Related guides
Go deeper on the pieces of a replayable session.
DeepSeek Harness Tutorial
The full beginner-to-expert tour, including a one-frame intro to the trajectory view this guide expands.
Read the guideTrack Token Usage in DeepSeek Harness
Turn the trajectory's request stats into a cost picture — budgets, per-session spend and cheaper models.
Read the guideDeepSeek Harness Troubleshooting
When the receipt shows something went wrong, here is how to diagnose and fix the common failures.
Read the guideDeepSeek Harness Subagents Guide
Subagents spawn extra sessions with clean context — learn how their work shows up in your history.
Read the guideBest DeepSeek Harness Skills
The skill entries worth installing — the same skill calls you will see stamped in every trajectory.
Read the guideDeepSeek Harness Remote Access
Reach the same web UI and its session history from your phone or another machine.
Read the guideSources & credits
Frames come from Shab Noor's clean screencast; the trajectory walk-through and the branch-to-new-session demo follow AI超元域's Chinese hands-on (its screencast carries a webcam overlay, so none of its frames are reproduced). The Session log button's download behavior matches our token-tracking guide's verification. Every image deep-links to the exact moment in its source video.