
DeepSeek Harness for Research Data Analysis: Clean, Test, and Plot a 100k-Row Dataset
A 22-minute screen recording, frame by frame: point dsh at a real 101,766-row diabetes EHR table and get cleaning, quality auditing, Cox survival analysis, journal-style figures and a formatted Results chapter in one session — for ¥3.10 of API credit.
Last updated: 2026-10-01
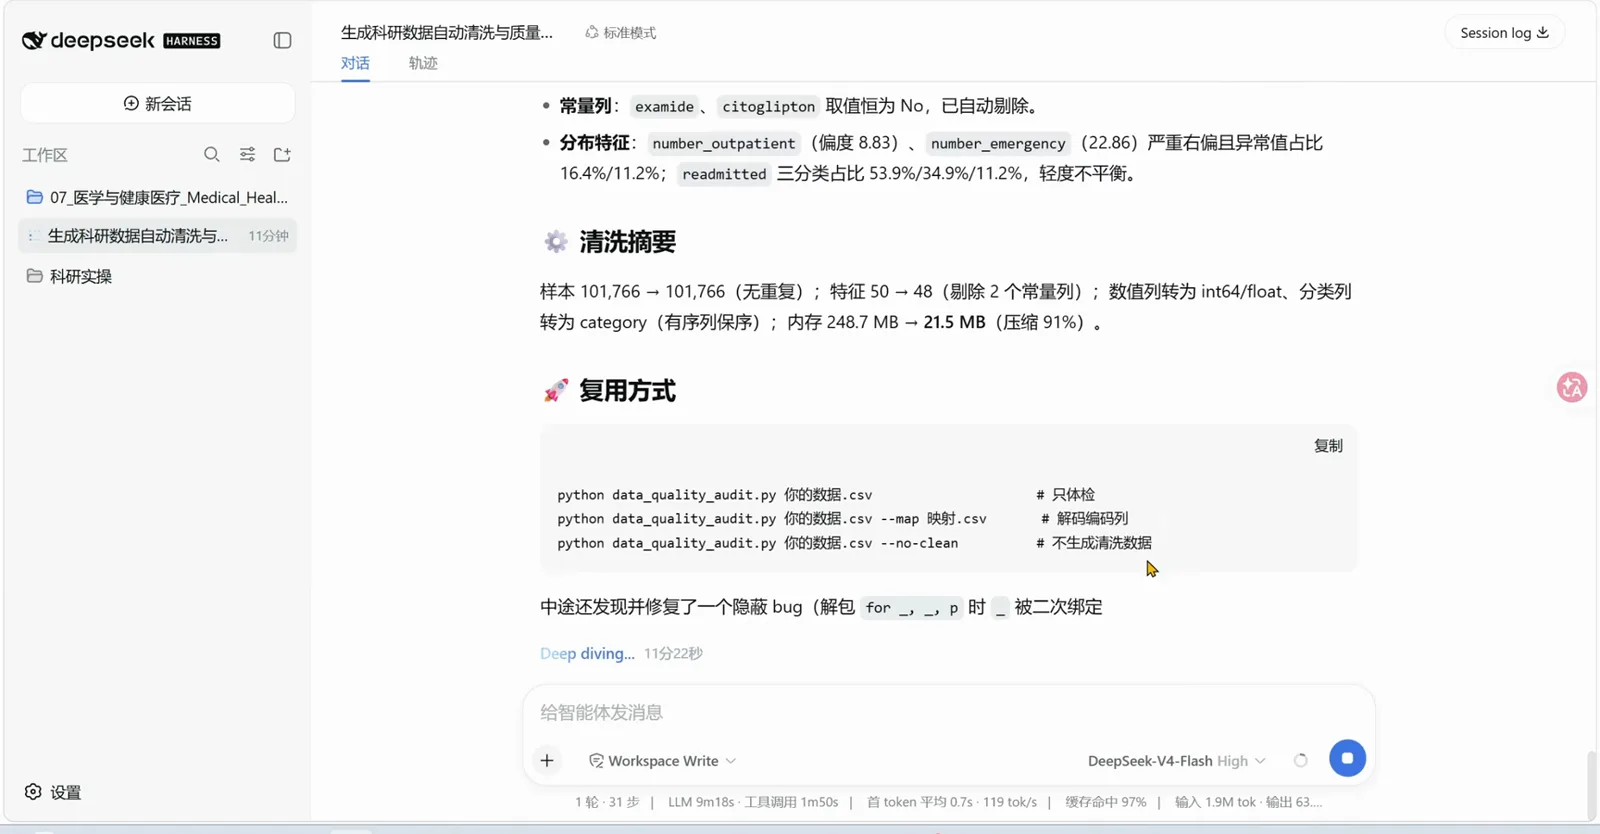
Real research data is hostile: coded columns, mixed types, six figures of rows. This guide follows a 22-minute screen recording (credited below) in which a researcher hands DeepSeek Harness a genuine public dataset — the 100k-row US Hospitals Diabetes EHR inpatient table — and gets profiling, cleaning, a quality report, Cox survival analysis, publication-style figures and a formatted Results chapter out of one session, for about the price of a bottle of water.
Every stage below is a frame-checked screenshot with a deep link back to the recording. If dsh itself isn't installed yet, start here: What is DeepSeek Harness, and what are dsh plugins?
TL;DR
- ▸One prompt on a real 101,766-row EHR table: two always-'No' columns (examide, citoglipton) dropped, 50 → 48 features, dtypes converted, memory compressed 91% — 248.7 MB → 21.5 MB.
- ▸The agent audits its own work: it caught two bugs in its own audit script, edited the file four times, reran and delivered a data-quality report — 6 rounds, 98 steps, zero hand-written code.
- ▸A plain-Chinese Cox prompt ("variable choices are up to you") plus a Nature-grade-figure request returns lifelines/R survival code and dpi=300 figures in PNG and SVG.
- ▸The Results chapter lands as a formatted Word doc — real computed numbers, three-line tables — and the entire recorded run cost ¥3.10 across 353 API requests.
From a raw 100k-row table to a Results chapter
Part 1 · One-time setup
- 1
Bring your own DeepSeek API key
Everything runs on your own key. The recording stops at the open-platform usage page first — ¥5.67 of balance, ¥14.32 cumulative spend, 254 requests and 3,255,296 tokens from earlier experiments — then creates a key and pastes it into dsh's "Add an API key" dialog. Keep this page in mind: you'll come back for the receipts at the last step.
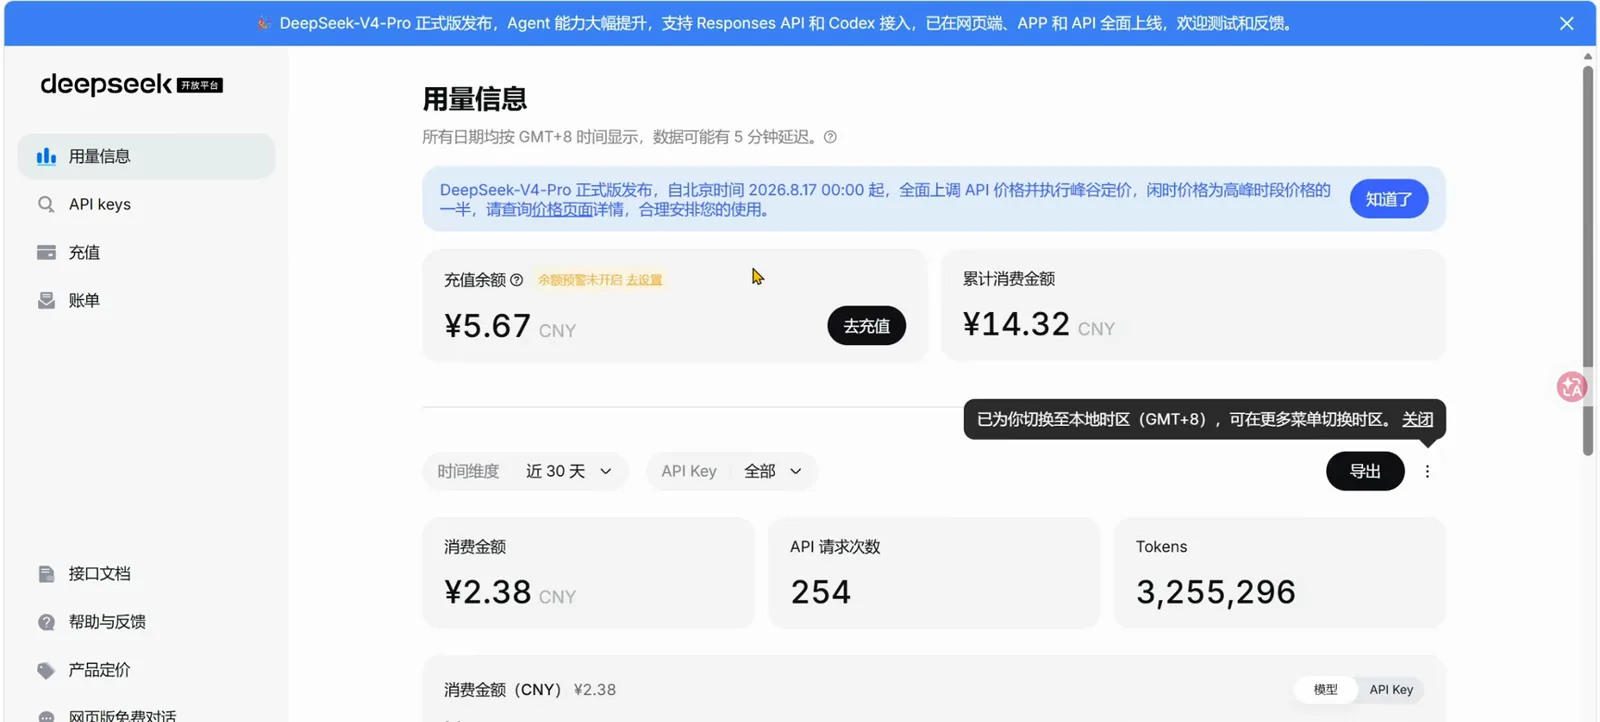
Create a key on the DeepSeek open platform — the usage page later doubles as your receiptWatch at 2:45 - 2
Pick the model: V4-Flash or V4-Pro
In a new session inside the 07_医学与健康医疗 (Medical & Health) workspace, the picker offers exactly two models: DeepSeek-V4-Flash, the default with the High reasoning setting, and DeepSeek-V4-Pro. The entire 22-minute run — cleaning, statistics, figures, the Word document — plays out on V4-Flash; Pro waits for heavier lifts.
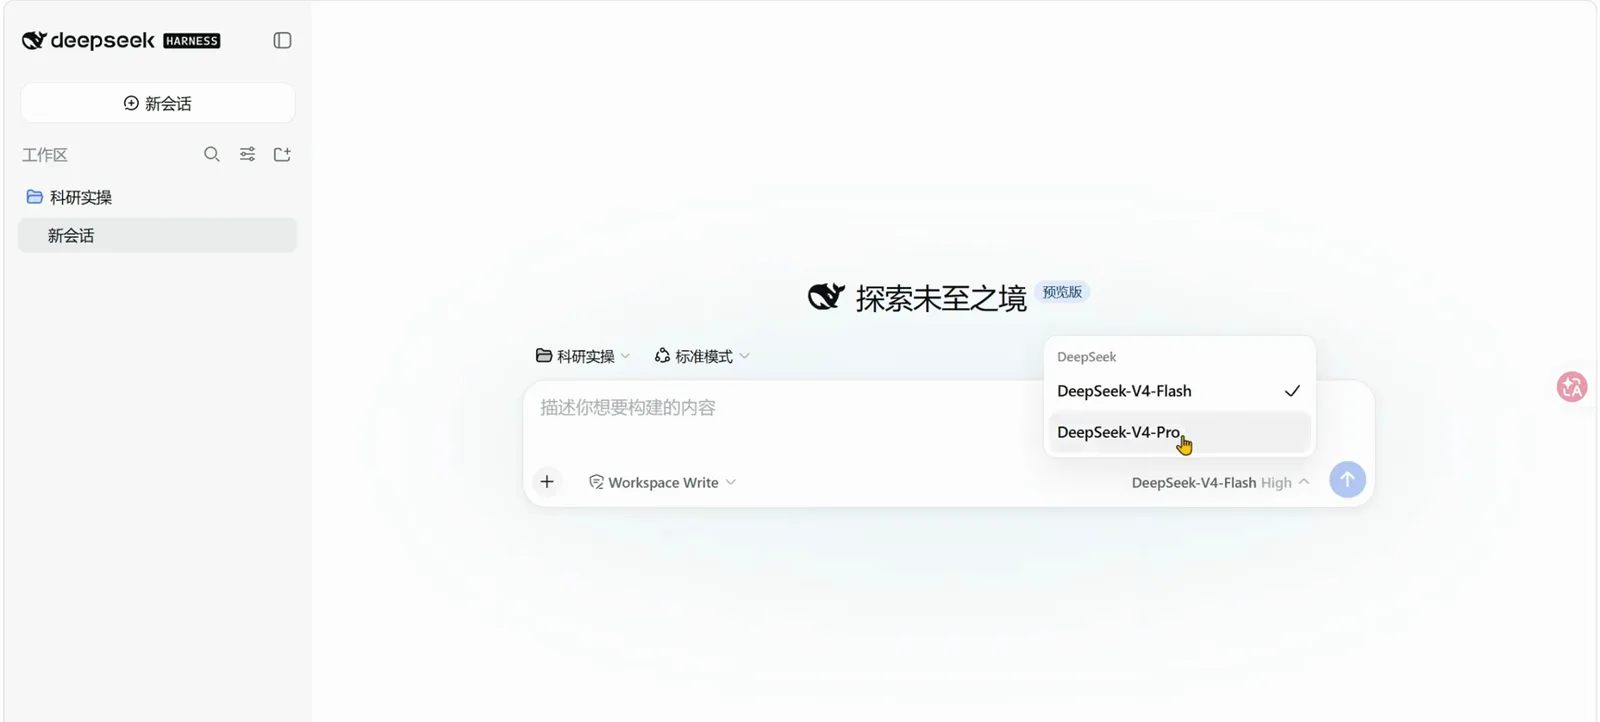
Two models on the picker: the run stays on V4-Flash (High) the whole wayWatch at 3:45 - 3
Hand it the raw 100k-row table
The demo data is a genuine public set: US_Hospitals_Diabetes, a 100k-row EHR inpatient table with 101,766 admissions. In Excel it looks hostile on purpose — a coded race value in the formula bar, medication columns filled with No / Steady / Down / Up, mixed types everywhere. That mess goes in untouched; decoding it is dsh's job, not yours.
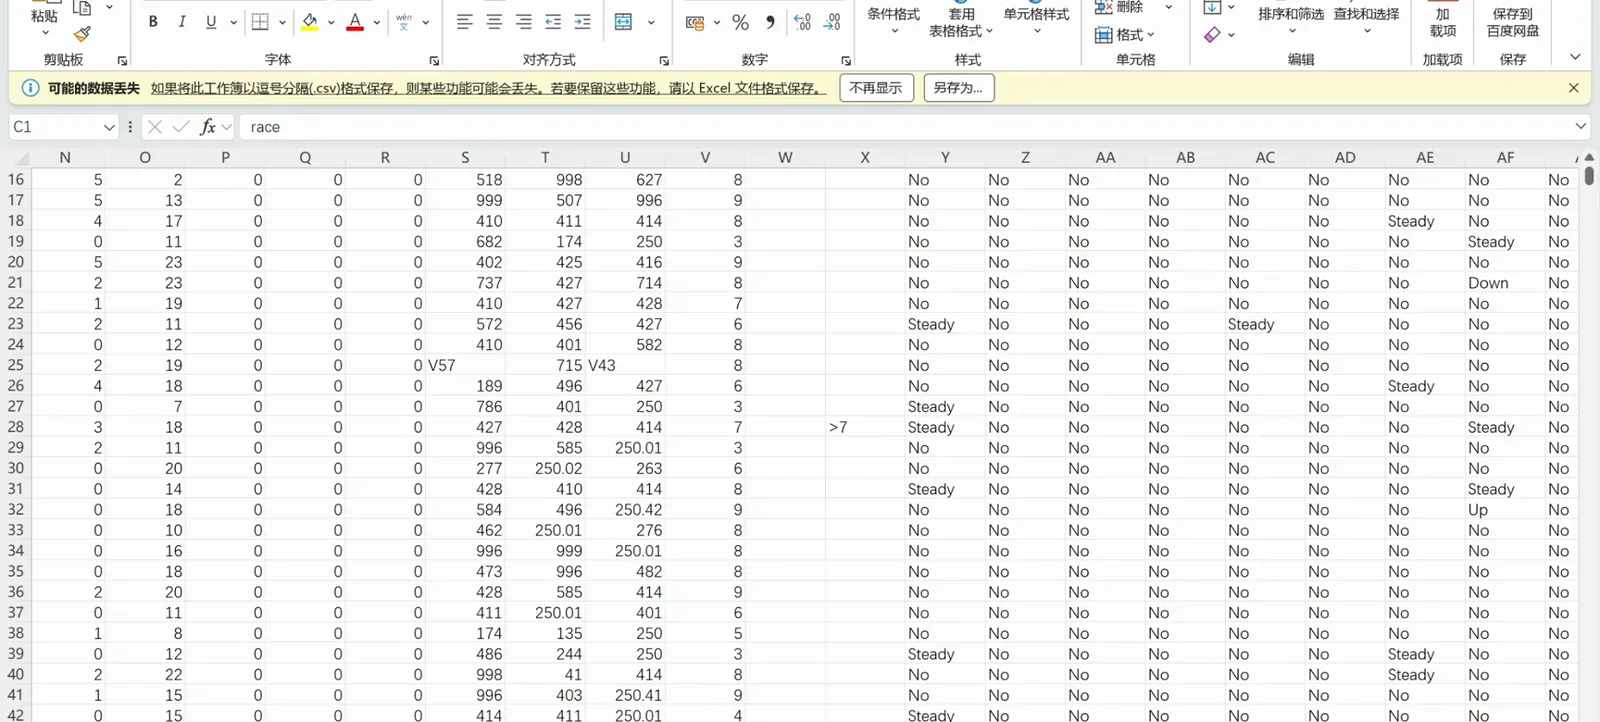
The raw table: coded values and mixed types — exactly what you hand over unmodifiedWatch at 5:00
Part 2 · Clean, audit, add statistics
- 4
One prompt starts cleaning — and the agent grades itself
A single Chinese sentence — profile the data, clean it, audit the quality — starts the pipeline. The session writes data_quality_audit.py, then catches two bugs in its own code: a type-inference order that fired to_datetime warnings on the age/weight interval columns, and a tuple-indexing slip on a missing dictionary. It Edits the file four times, reruns it in PowerShell and reads back 01_Diabetes_EHR_data_quality_report.md — 6 rounds, 98 steps, 24m7s of LLM time, 99% cache hits. The script it leaves behind is reusable:
$python data_quality_audit.py 你的数据.csv # 只体检$python data_quality_audit.py 你的数据.csv --map 映射.csv # 解码编码列$python data_quality_audit.py 你的数据.csv --no-clean # 不生成清洗数据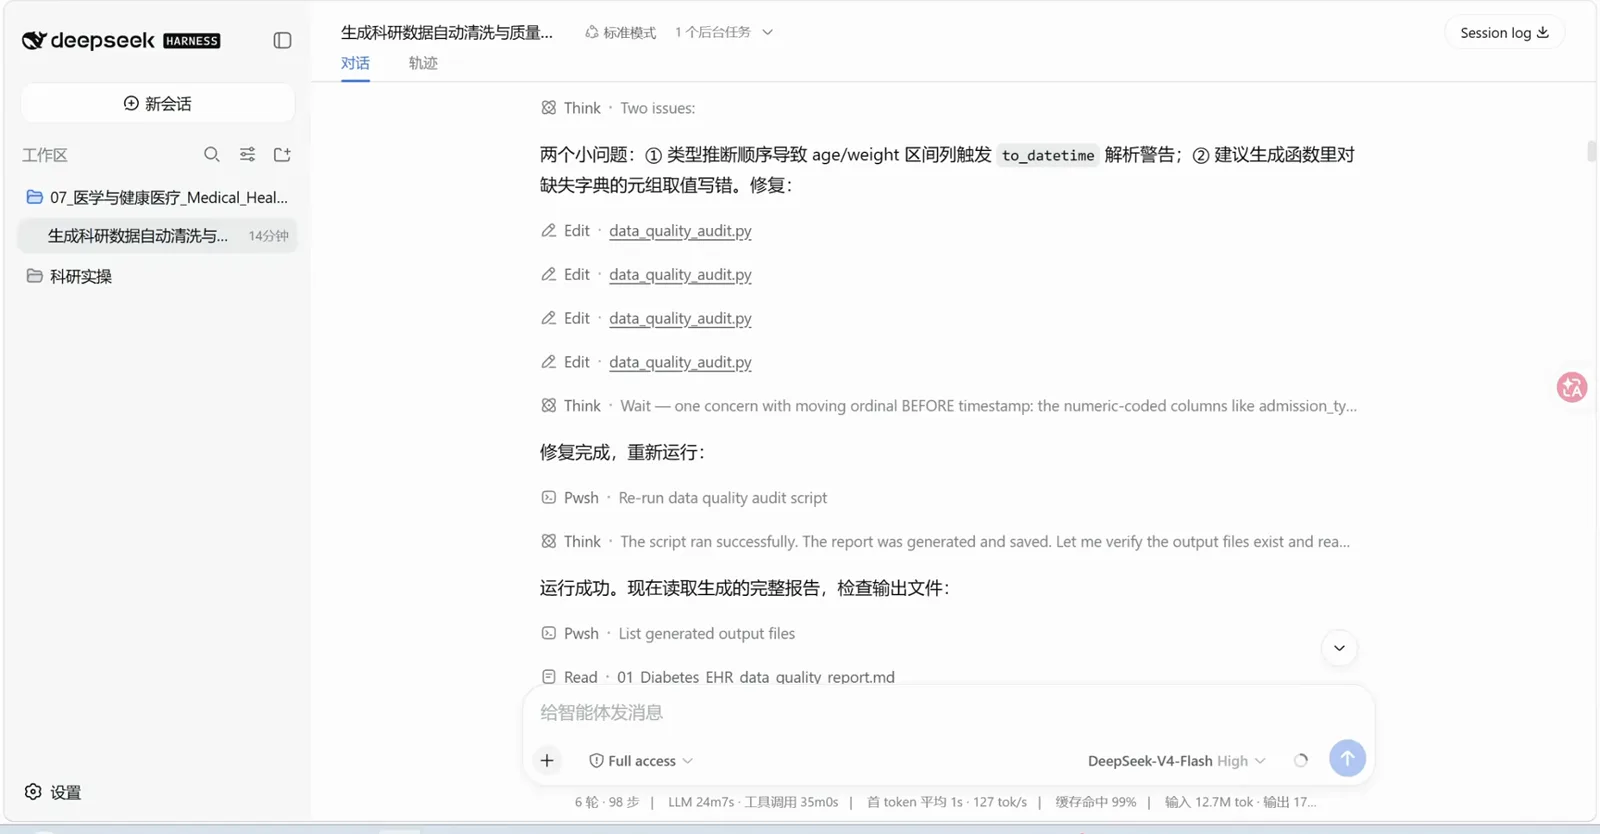
Self-directed debugging: 4 edits, a rerun, and the quality report read back — no human in the loopWatch at 1:00 - 5
Add statistics with a persona prompt
Statistics arrive the same way. The recording types a survival-analyst persona — "you are a biostatistician for oncology and chronic disease… write Cox proportional-hazards code with Python lifelines / R survival" — leaves follow-up time, event flag, strata and covariates deliberately blank ("the variable choices are up to you"), and appends a request for a Nature-grade scientific figure designer. Above the input box, the report check has already confirmed examide was dropped and the cleaned CSV structure verifies.
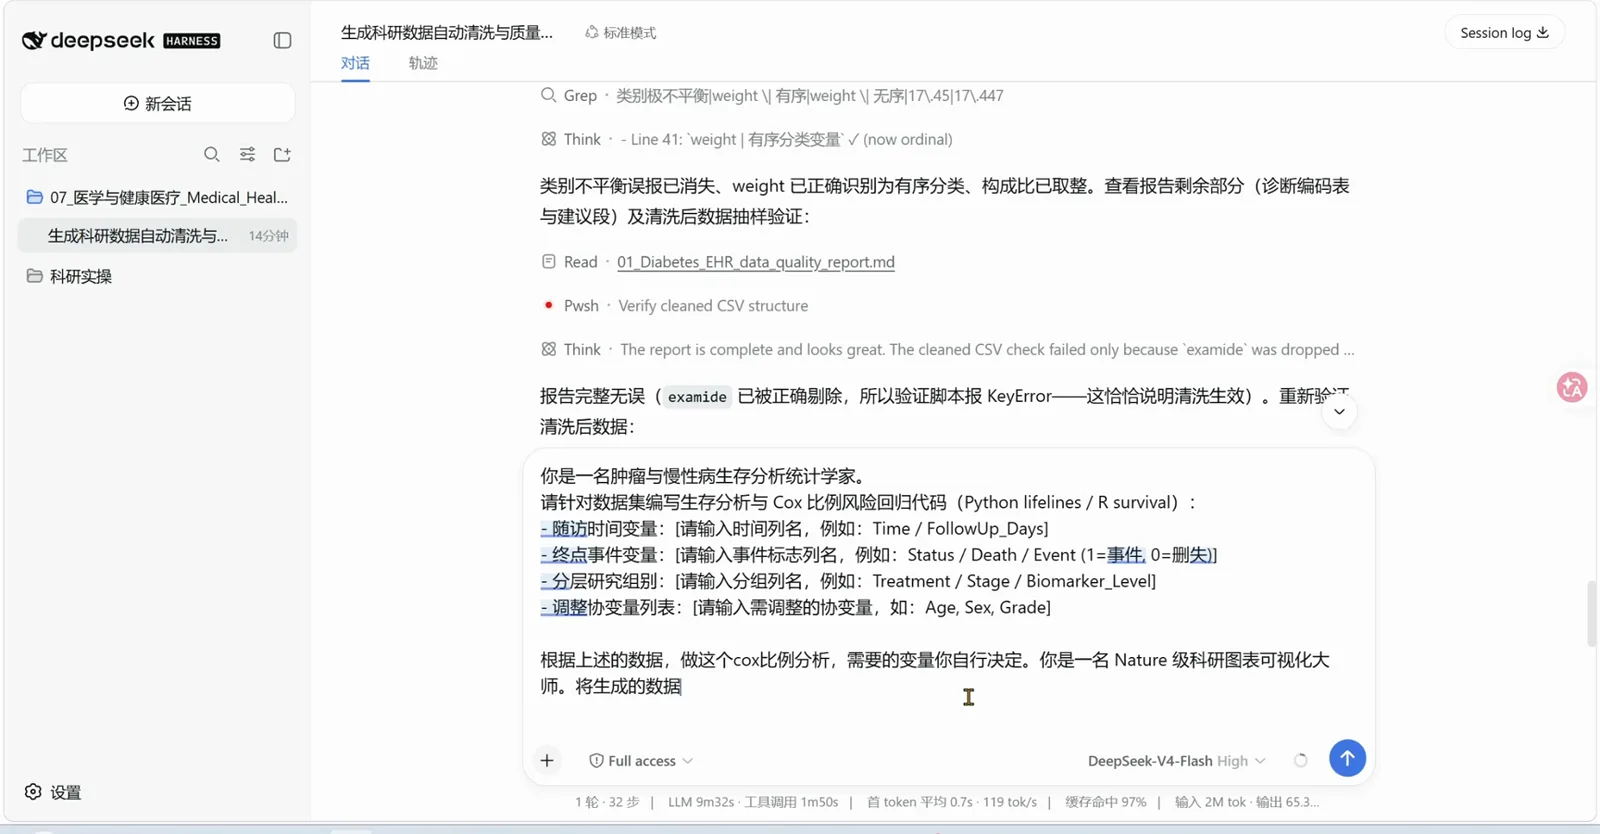
One paragraph of Chinese: Cox regression with the variables up to the agent, figures includedWatch at 10:15
Part 3 · Figures, paper text, receipts
- 6
Journal figures follow a written spec
The figures aren't luck. The author maintains a 16-page prompt manual (see Sources); page 11 fixes the raincloud recipe: half-violin KDE + boxplot + jittered points at alpha 0.6, significance brackets at p<0.05 / 0.01 / 0.001, the Nature/Lancet palette #4DBBD5 #E64B35 #00A087 #3C5488, despined axes, and a hard rule of dpi=300 PNG plus an SVG copy for later layout.
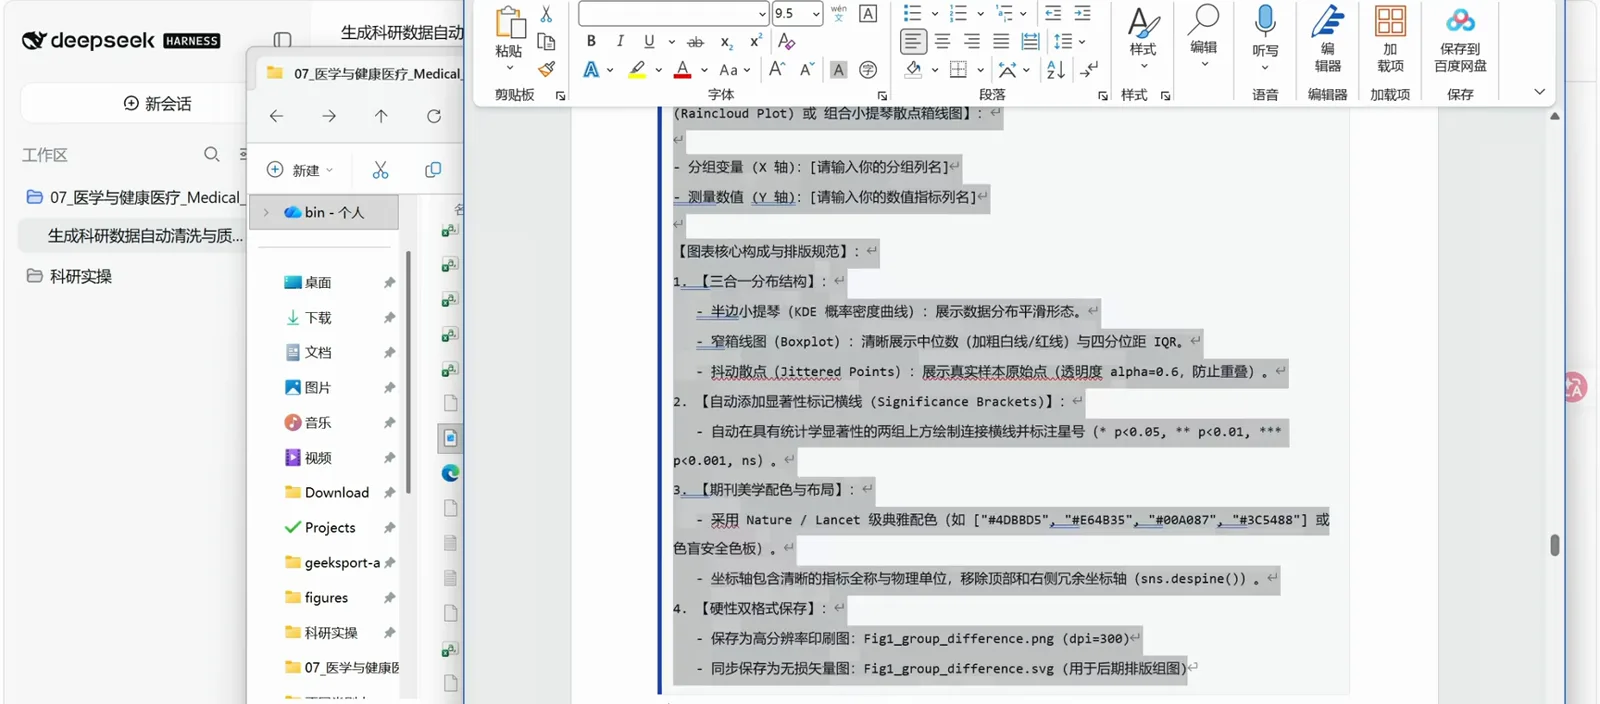
Page 11 of the prompt manual: the raincloud recipe, colors, brackets and the dpi=300 ruleWatch at 15:00 - 7
The Results chapter writes itself — with real numbers
generate_results_docx.py produces output_results.docx with the statistics computed, not invented — the session's own words are "every statistic computed from the 1,000 rows of real data." The demo Results section covers a 1,000-inpatient subset: 796 medicated vs 204 unmedicated patients, age 59.86±17.54 vs 64.41±17.24 (Welch t = 3.35, P < 0.001), ER admission 21.0% vs 9.8% — and Table 1 renders as a proper three-line table (1.5 pt top/bottom rules, 0.75 pt mid-rule, no vertical lines). The session even verifies the file at XML level: 122 Runs font-compliant.

The Results chapter as a Word doc: computed numbers, three-line Table 1Watch at 16:00 - 8
Everything lands in the folder, not just in chat
When the run ends, the workspace holds every artifact as a file: the figure in both formats (Fig1_group_difference.png, 146 KB; .svg, 204 KB), the scripts (raincloud_plot.py, survival_cox_analysis.py, data_quality_audit.py, verify_and_explore_medical_data.py), survival_analysis_report.md, the cleaned survival_dataset.csv and the Word report — 23 items in all. Rerun with new data and the same names get overwritten; nothing lives only in the chat log.
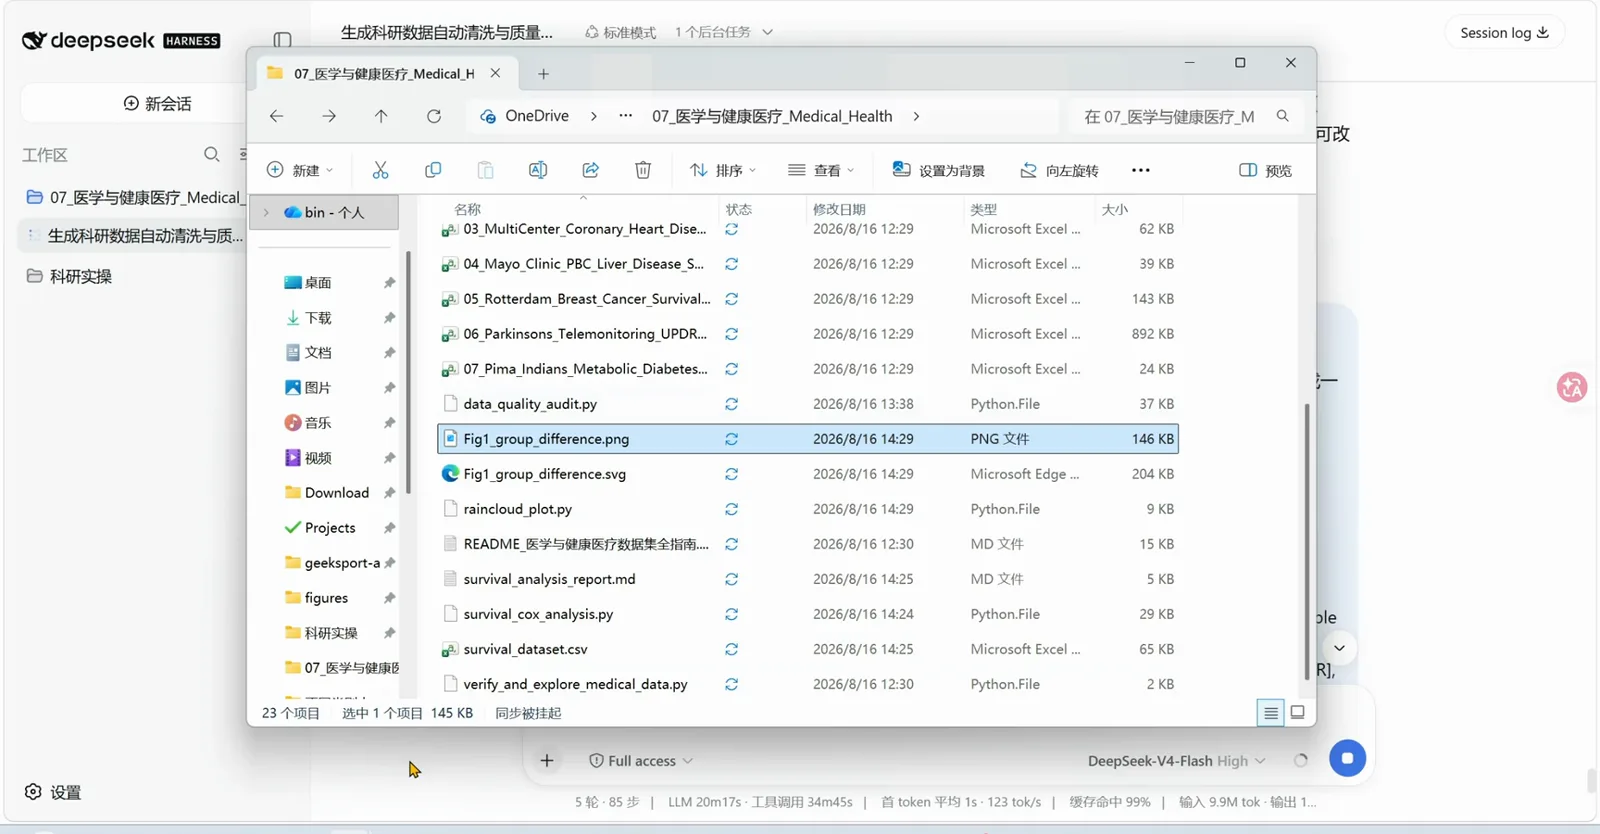
After the run: figures, scripts, report and cleaned data — all as plain filesWatch at 15:30 - 9
Check the bill before you brag
The video closes on the DeepSeek usage page: the whole run — cleaning, statistics, figures, the Word document — consumed ¥3.10 across 353 API requests and 16,137,371 tokens over the visible month, the August 16 spike costing ¥0.73 on deepseek-v4-flash. Same page, last step of your own first run.
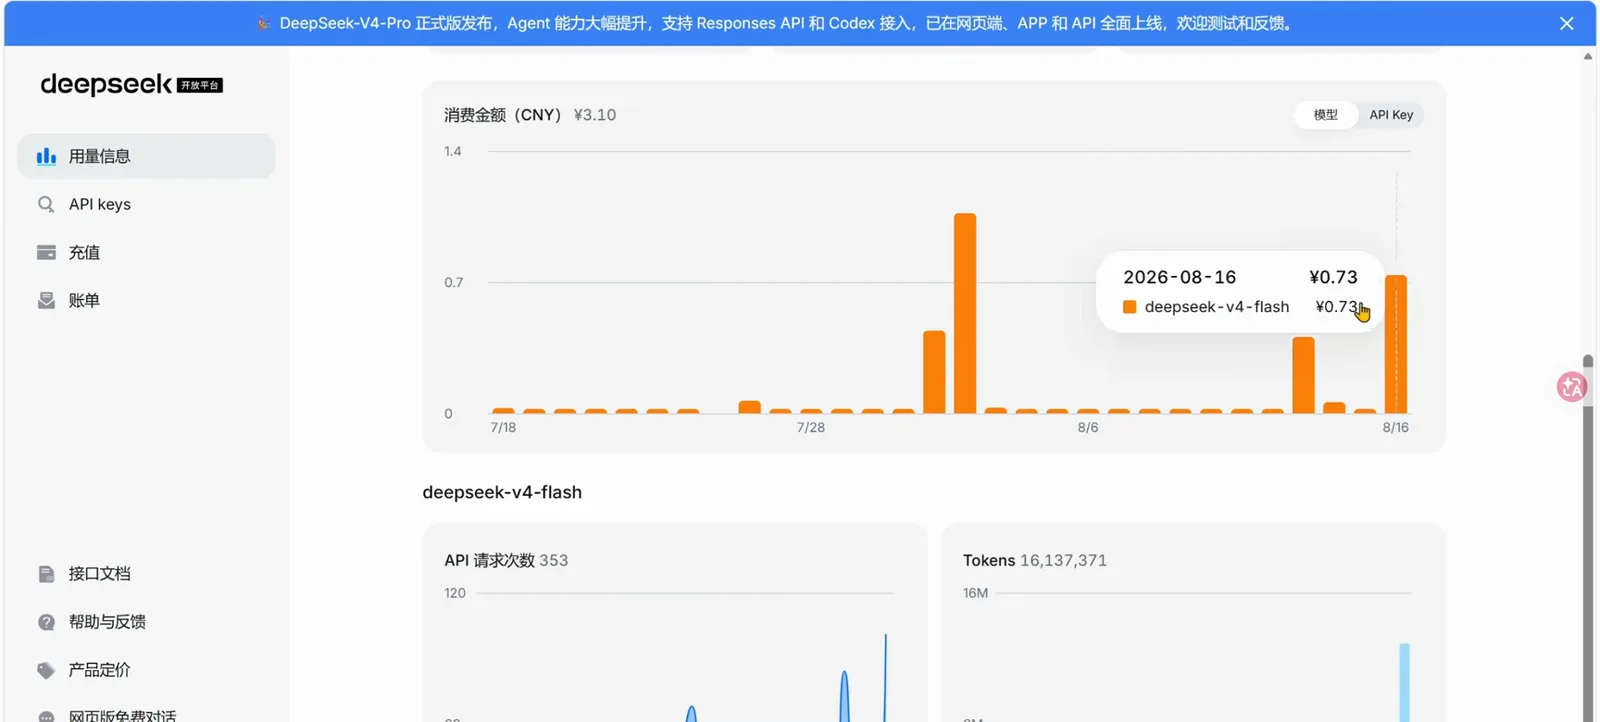
The receipt: ¥3.10 and 16.1M tokens for the whole recorded workflowWatch at 21:00
FAQ
What researchers ask before pointing dsh at their own data.
Do I need to know Python or statistics to run this?
No. Every prompt in the recording is plain Chinese; the agent writes, debugs and reruns its own Python — it even fixed two bugs in its own audit script unprompted. You do need to judge the statistics before publishing them: the video's author personally audits the generated code and tables at the end.
Does this only work with the diabetes dataset?
No — US_Hospitals_Diabetes is a public stand-in. The recording's workspace folder holds other public sets (coronary heart disease, Rotterdam breast-cancer survival, Parkinson's telemonitoring, Pima Indians diabetes), and the leftover script is parameterized: point data_quality_audit.py at any CSV, pass --map to decode coded columns or --no-clean for an audit-only pass.
Will a 100k-row table blow up my machine?
The recording shows the opposite: converting numeric columns to int64/float and categorical columns to ordered category shrank the table from 248.7 MB to 21.5 MB — 91% lighter before any analysis started. Profiling runs first, so you see the shape before anything touches the numbers.
Can the Results chapter go straight into a paper?
Treat it as a verifiable first draft. The session computes the statistics from the data — the demo subset is 1,000 inpatients — and XML-checks the docx formatting (fonts, spacing, three-line table rules), but the author still audits code and tables by hand before trusting them. Reproduce the numbers in your own environment and have a statistician review; this page is a methods demo, not medical advice.
Related guides
Same engine, neighboring workflows.
Merge Excel sheets with one prompt
The little sibling workflow: three expense sheets, 1,800 rows, consolidated with rules, field mapping and acceptance criteria in one session.
Read the guideOne prompt to a presentation deck
The office plugin family behind polished Word/PPT output — useful once your Results chapter needs slides around it.
Read the guideThe long-form writing workbench
Chapter planning and style locks for book-length drafts — the writing half of a research pipeline.
Read the guideDeepSeek models, switched per task
V4-Flash vs V4-Pro and the reasoning settings behind the picker you saw in step 2 — when to stay cheap and when to pay.
Read the guideTroubleshooting encyclopedia
Install failures, startup crashes, broken updates — matched against real fixes before you retry your own run.
Read the guideAcademic plugin collection
The research-oriented plugins — literature, citations, data — that extend this analysis workflow.
Read the guideSources
Frames and every on-screen number come from the first recording, re-read at full resolution; the research-plugin shortlist is corroborated by the second channel; the chart and three-line-table rules are quoted from the author's downloadable prompt manual. The dataset is public data as stated by the author; all statistics shown are demonstrations of the workflow, not medical advice.